Basics of Orderflow
What is Orderflow
Orderflow is the study of volume.
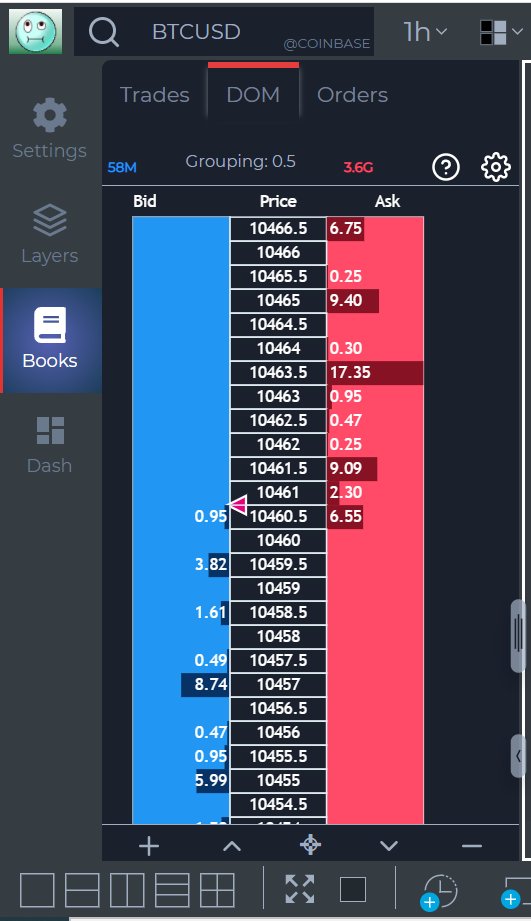
Below is a Depth of Market (DOM). DOM comprises of Limit Orders pendig in the books
The Blue ones = Bid Limit orders
Red ones = Ask Limit orders
So what happens to these orders in the trade cycle
NOW LET’S TRY AND UNDERSTAND ALL OF THE ABOVE WITH A SIMPLE EXAMPLE
Let us assume you walk into a shop to buy an air conditioner (AC) which you desperately need in the peak summers. The shopkeeper tells you that the price of the AC is 35 k, which you think is expensive. This price of 35k which the shopkeeper quoted is Ask Price.
Since you feel the ask/offer price by the shopkeeper is high, you tell him that you can only pay 30 k for the AC. This price quoted by you is the Bid Price Now one of you (shopkeeper or you) has to accommodate for the sale of the AC. This is called an Auction.
Since it is peak summer and the demand is high, the shopkeeper isn’t budging. So you go ahead and buy the ac at his offer/ask price. This is called Lifting the Offer.
Now let’s consider one more example. You want to sell your old car, but the demand for old cars in the present market isn’t that good. A buyer comes to you to purchase your old car. You tell him the price of car is 100K (Ask Price), but he isn’t willing to pay that and is willing to walk away unless you give him car for 80K (Bid Price). He isn’t going any further up.. So what do you do. You reduce your ask/offer. This is called Hitting the Bid.
In both the cases you were the aggressor. Now let’s focus on Imbalance.
Imagine yourself going to farmer’s market. What do we do when we buy vegetables? We bargain. You want a kg of tomatoes. Shopkeeper tells you his ask/offer price as 20/kg, and you tell him your bid price of 10/Kg. Now plot the bid and ask opposite each other in a table.
The offer/ask price of the shopkeeper of 20 would be on the upper right and your bid price would be on the lower left.

Now you start bargaining.. you move up to 12 (move up the left side of the column) and the shopkeeper moves down to 18(moves down the right side of the column).. this keeps on going till you reach the price of Rs 15 and you finally buy the vegetables. Auction ends

Next guy walks in and starts another auction. This is exactly what is happening in the markets, just at a very large scale. The auction always takes place diagonally with the bid price (limit buy order) on the left side and the ask price (limit sell order) on the right.
Such Limit Orders are invariable absorbed by the Market Orders. It is the Market Orders that drive the markets up and down. Market Orders measure the sentiment of the buyers and sellers.
Every auction starts with Bid and Ask
Market orders move the price
Orderflow
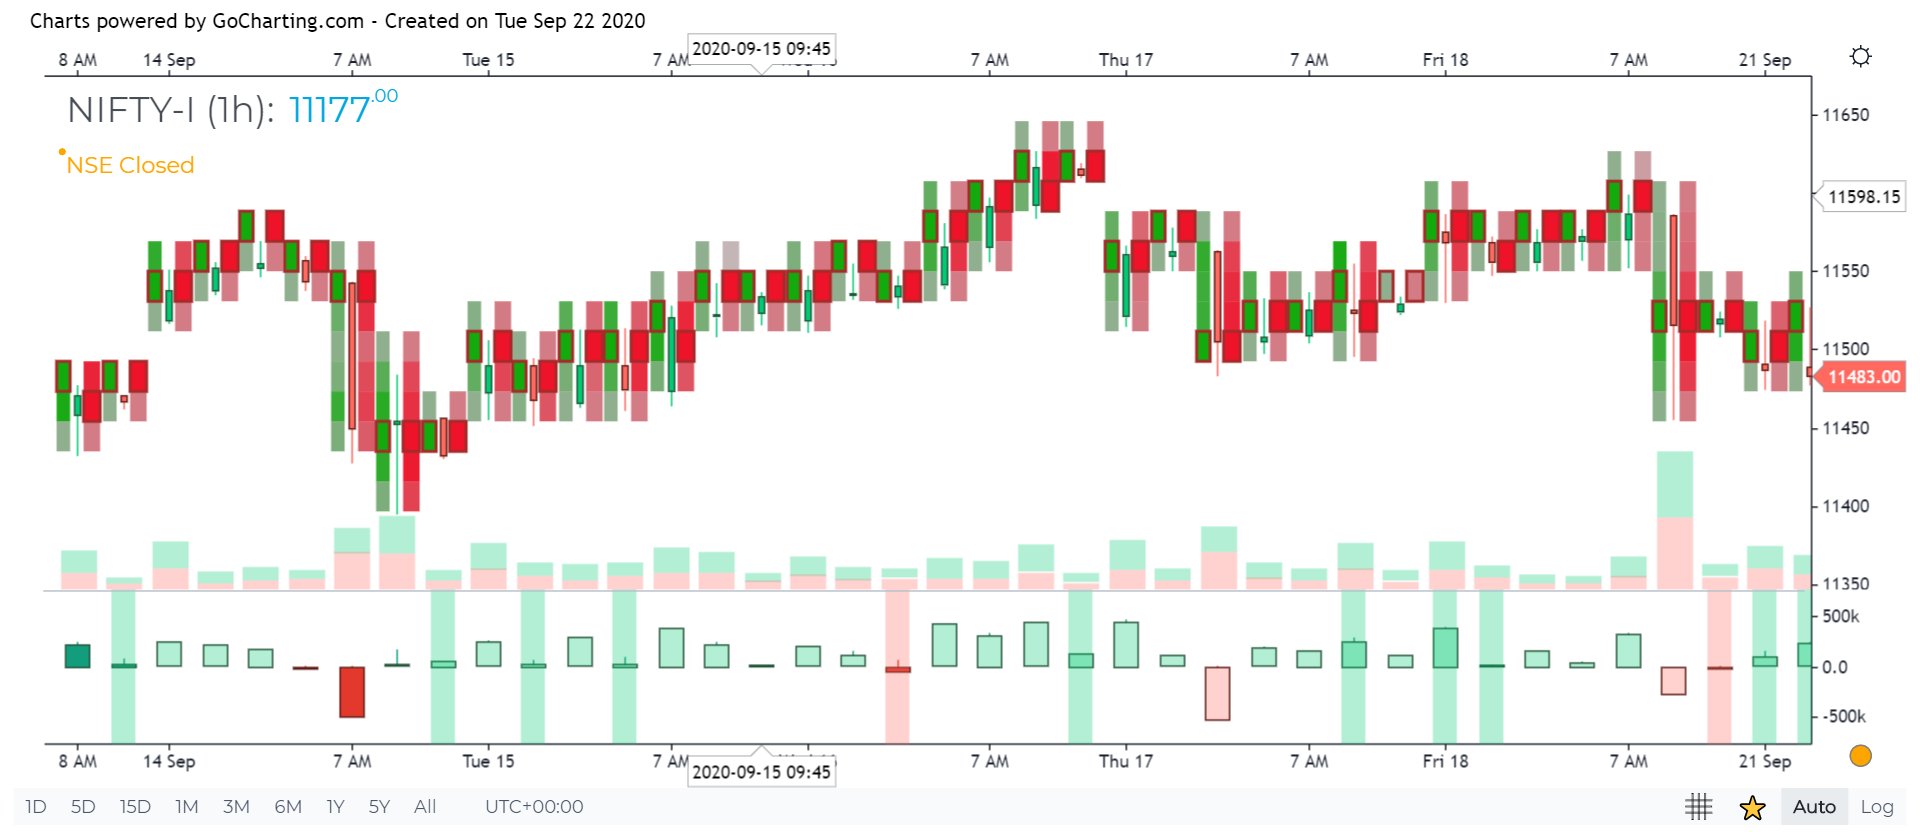
So how do we track these market orders. We track them on the Footprint aka Cluster charts. o what you see on the Foorpint aka Cluster chart is Market Orders and what you see on DOM are the Limit Orders i.e., orders waiting to be executed. When the buyers are aggressive, they will take out all the Limit Orders on the Ask side. Similarly when sellers are aggressive, they will take out all the Limit Orders on the Bid side

What is Footprint aka Cluster Charts
Footprint chart is a type of candlestick chart, however it provides additional information such as bid/ask/total volume at every price, in addition to the open, high, low and close seen on a basic candlestick chart. Footprint charts are special as they are multi-dimensional in nature and allow traders to observe additional market variables overlaid on a candlestick chart like volume, bid-ask spreads, and liquidity levels. Traders have the ability to customize footprint charts to include those individual variables that is most suited to them and which would eventually help them gauge the sentiment. The variations that can be configured for a footprint chart would be discussed in the later part of the section.
Understanding Footprint Charts
Limit Orders
These are orders that are placed either below or above the current market price and ensure that a trader does not pay more than their ideal price.
Market orders
These are orders that are executed as soon as possible at the market price, reducing liquidity of the market. Price will only change once liquidity (limit orders) at a certain price has been exhausted. As a result, market orders are the main drivers of price movement and are not revealed by a trader until it is absolutely necessary. In other words, the market can only move through direct market orders which are consuming the limit orders of the order book
When a trade is filled, a limit order has been matched with a market order. Buying pressure is observed when buy market orders are matched with sell limit orders, whereas selling pressure is observed when sell market orders meet buy limit orders.
systems that can be purchased on a subscription basis as an add-on to standard software services.
What do you see in a normal Footprint Chart**:**
- Volume Point of Control (VPOC – most traded volume in the candle)
- Traded volume on ASK
- Traded volume on BID
- Candle open
- Candle close
- High and low of the candle
- Buy or sell imbalance
The price of any instrument depends on whether you wish to buy or sell. If you wish to buy the price you pay is the ask or the offer price. If you wish to sell the price you pay is known as the bid.
The act of buying is known as taking the offer or lifting the ask. The act of selling is known as hitting the bid.
What’s important to understand is because a price quote is made up of a bid and an ask price, you have to look at the chart diagonally.
Next, what is Trading DOM, which stands for depth of market. This display shows all of the resting limit orders in the market. Since the introduction of algorithms a lot of the orders resting in the book will never trade. The algorithms constantly add and pull orders in and out of the market. Therefore, it sometimes becomes difficult to trade simply out of DOM.
Footprint charts on the other hand help us to visualise what we are actually interested in i.e. EXECUTED ORDERS aka MARKET ORDERS. Not the transactions that are advertised of potentially trading in the trading DOM.
What is Imbalance?
Consider the buying vegetable example again; only this time when you go to buy tomatoes another 10 guys are standing right besides you, however this particular shopkeeper has the only 5 kgs of tomatoes left. What do you think is going to happen?
You immediately buy at 20, the next guy at 21, the one after that at 22 and so on. Why do you think this is happening?
There is a gross mismatch between the buyers and the seller in this case. People eager to buy the tomatoes at any cost are lifting the offer one after the other. Buying frenzy. Now once this proportion of aggressive buyers to sellers is more that say three times, you say there is an imbalance of 300% his same behaviour is seen in the Imbalance Chart

What is Delta
Delta is defined as the difference between the BUY and SELL market orders in terms of volume
DELTA = BUY Volume – SELL Volumes
- Delta = Positive => Aggressiveness on the Buy side
- Delta = Negative => Aggressiveness on the Sell side
Generally you would expect Price to move ⬆ when Delta is positive and Price to move ⬇ when Delta is negative. So what heppens when the above rule is not followed.
We have Divergence
orderflow
Any two parameters that should be in sync (Price and Delta in this case) towards supporting a particular move (Up or Down) but are in reality not (in sync) form a Divergence
Divergence is best shown by the green and red bands on the Orderflow Indicator called Delta Bars.
So how does this Divergence take place?
Say, Delta = Positive but Price does not move up. So more aggressive Buy market orders than Sell market orders and yet price does not move up. This is so because some institution (FII/DII/Whale) is simply absorbing all the Market buy orders with Limit orders, which is happening without you coming to know of it. When the institution deems all the market buy orders are absorbed, they start selling with Market orders
Basic Rules of Orderflow
Volume should increase (grow) in the direction of a health trend.
- In an uptrend, volume should increase as price moves higher and decrease (shrink) as price retraces
- In a downtrend volume should increase as price moves lower and decrease as price retraces
- Finally correlate Price and Volume with Delta
Price
Volume
Delta
Market
Rising
Increasing
Increasing Positive
Strong (UP)
Rising
Decreasing
Decreasing Positive or becoming Negative
Weak
Declining
Increasing
Increasing Negative
Weak (DOWN)
Declining
Decreasing
Decreasing Negative or becoming Positive
Strong
What is Profile Distribution
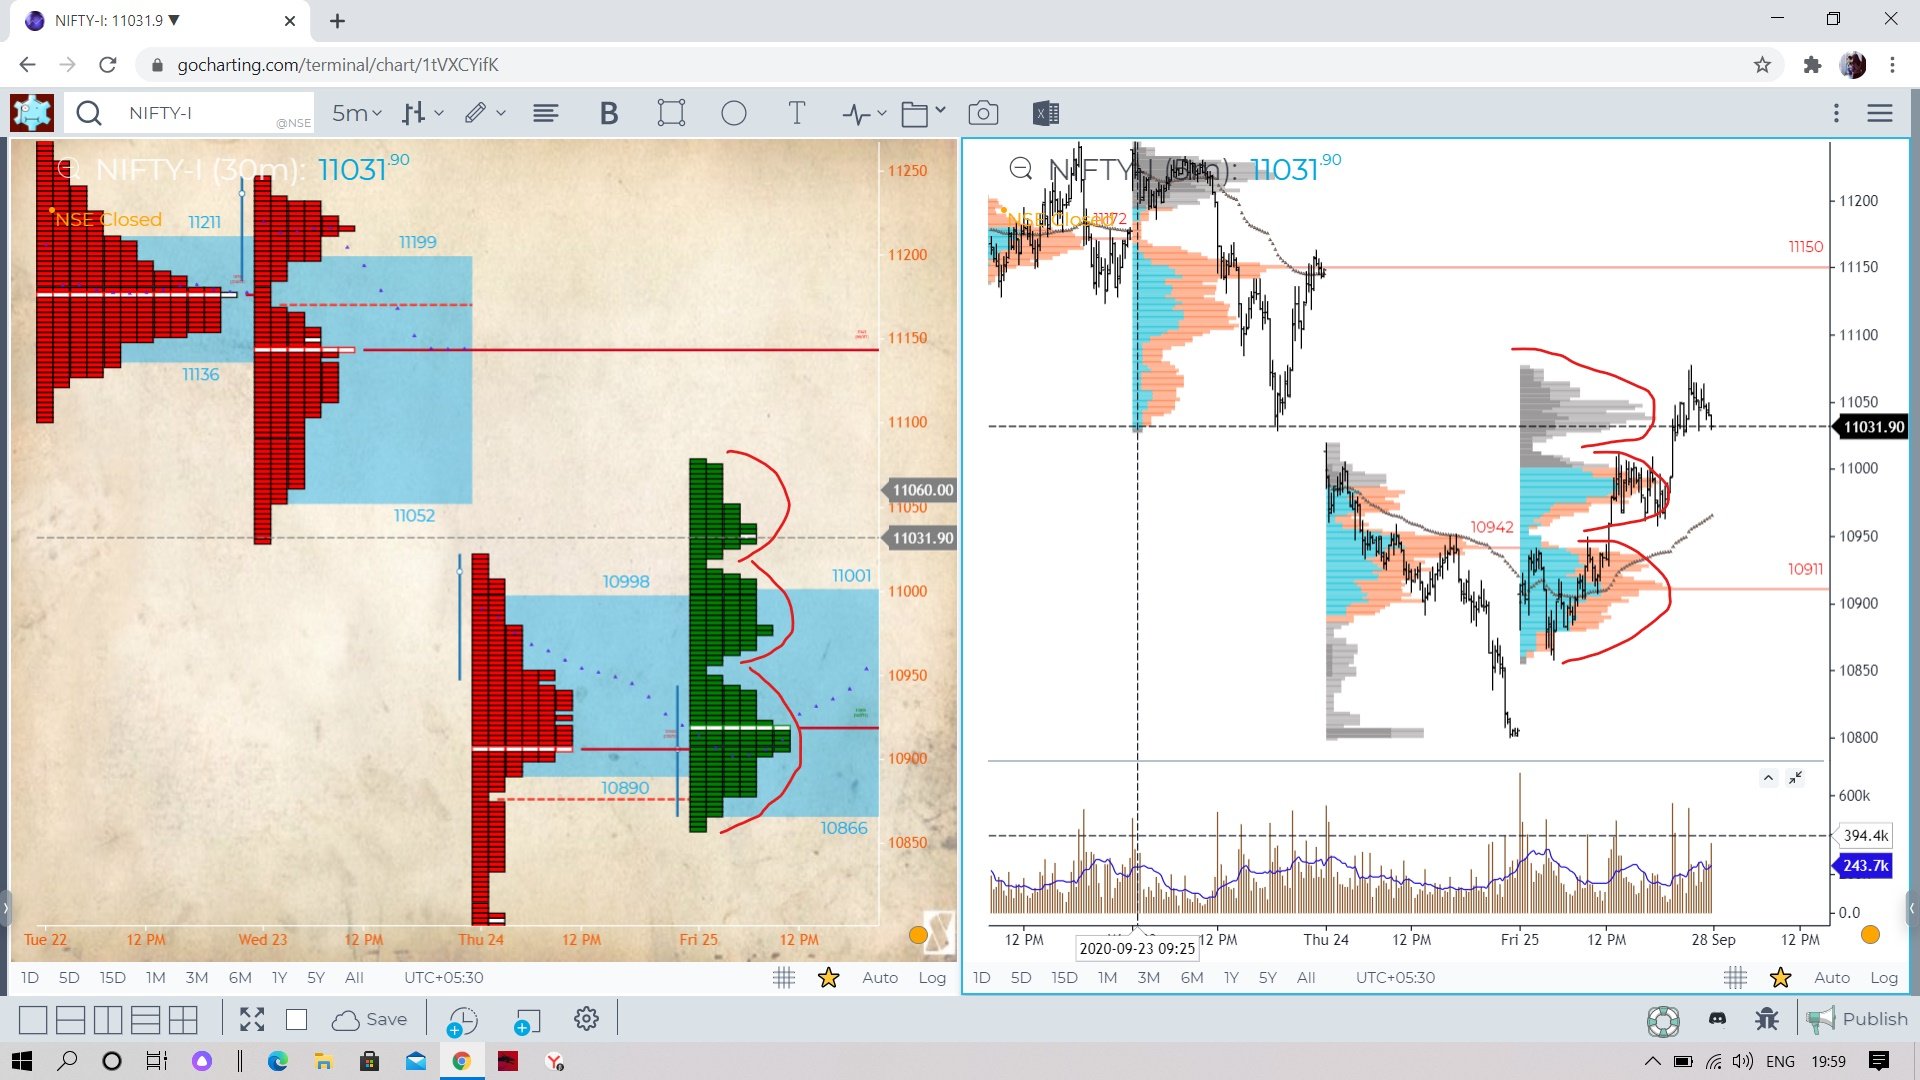
Distribution is the process of trading activity that takes place in the market auction. Some also know it by a consolidation or range. A Distribution tends to define the fairest area/ price where the current auction has been taking place. However, during some trading sessions, after the market forms a distribution around a certain fair price/ value, something changes driven by market news and macroeconomic events push the price around forming a new distribution. t could be anything – some big money stepping in deeming the price to be auctioning below value, news, event ,etc.. we don’t know that and it doesn’t matter
What we are interested in is what happens after the move. This sudden change causes the market auction to locate a new fair price and distribute around the new found fair price. Since this is a distribution separate from the initial one that had formed during the early part of the day we may call it the second distribution. Day as a whole could be called a double distribution day. For example
It seems something changed for a second time during the day and consequently the fair price also changed and a third distribution also formed (although in the later part of the day which is suspect sometimes).. this can also be called as a triple distribution day
Double Distribution
During some trading sessions, the market starts to distribute around a certain fair price. As the session develops, the perceived fair price suddenly changes due to news, events or changes in the market. This sudden change causes the market to locate and distribute around another new fair price. This new fair price may be above or below the previous fair price on the profile chart. In either case the market will create a new distribution around the new fair price, thus creating a double distribution for the session. If this event occurs during a trading day, the profile structure is described as a double distribution day or a “B” shaped profile.


