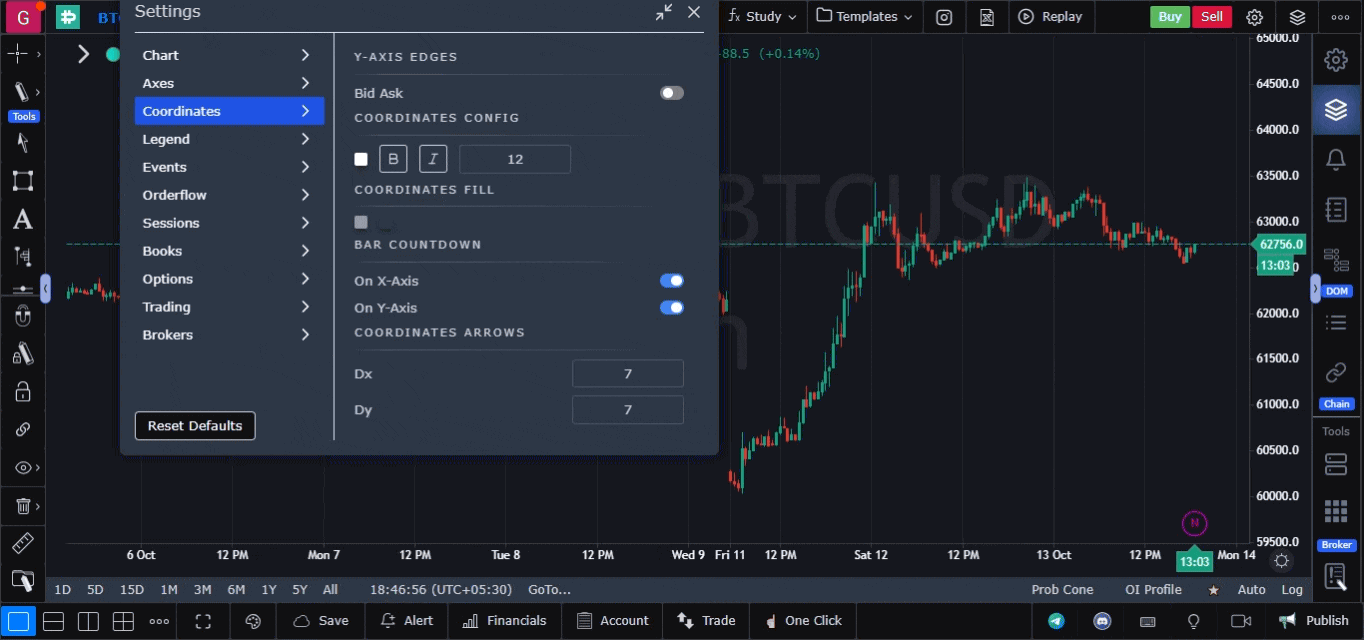
Coordinates Settings
Overview
The coordinates settings allow traders to fine-tune the display of price and time data on the chart axes. These settings provide options to customize how information like bid/ask prices and countdown timers are shown, enhancing the precision and clarity of your charting experience.
Accessing Coordinates Settings
- To access the Coordinates Settings, click on the settings icon located in the Top Right Corner of the chart.
- Once the settings menu opens, select the Coordinates Settings from the left panel of the pop-up window.
Available Coordinates Settings
-
Bid/Ask Display
- Enable or disable the display of bid and ask prices alongside the current price on the chart.
- This feature provides a more detailed view of the market’s price action, which is crucial for making informed trading decisions.
-
Coordinate Fill Adjustment
- Adjust the gap between the Y-axis and the chart border using the coordinate fill option.
- Modifying this gap can help in aligning the price scale to your preference and make the chart layout cleaner.
-
Bar Countdown
- Enable the bar countdown timer for the X and Y axes or for both.
- The countdown timer indicates the time remaining until the next bar closes, which is particularly useful for day traders and scalpers.
-
Arrow Sharpness for LTP and Timer
- Customize the sharpness of the arrows on the Last Traded Price (LTP) window on the Y-axis and the timer window on the X-axis using the Dx and Dy settings.
- Adjusting these parameters helps in improving the visual precision of the chart markers.
 )
)
Conclusion
The coordinates settings offer traders a range of options to refine how chart data is displayed, making it easier to analyze market movements with accuracy. Customizing these settings ensures that you have a clear and detailed view of key market information, tailored to your trading needs.
Use Case
Coordinate Settings in GoCharting allow precise positioning of drawing tools and annotations using exact price and time coordinates. This enables traders to anchor indicators and drawings at exact levels rather than relying on imprecise drag placement.
Strategy
Use Coordinate Settings to precisely place Fibonacci retracements, trend lines, and support/resistance levels at exact price values you identify from your analysis. This eliminates the visual approximation error that occurs when dragging drawings by hand.
Common Mistakes
Do not use Coordinate Settings for approximate visual-only annotations where precision is not required — the manual drag approach is faster. Avoid entering coordinates without first calculating the exact values from your analysis. Do not forget that changing the chart timeframe may affect drawing positions if they are time-anchored.