Community Workspaces & Chart Layouts
Explore Published Layouts · Chart Templates · Trading Setups
Discover chart layouts published by the GoCharting community
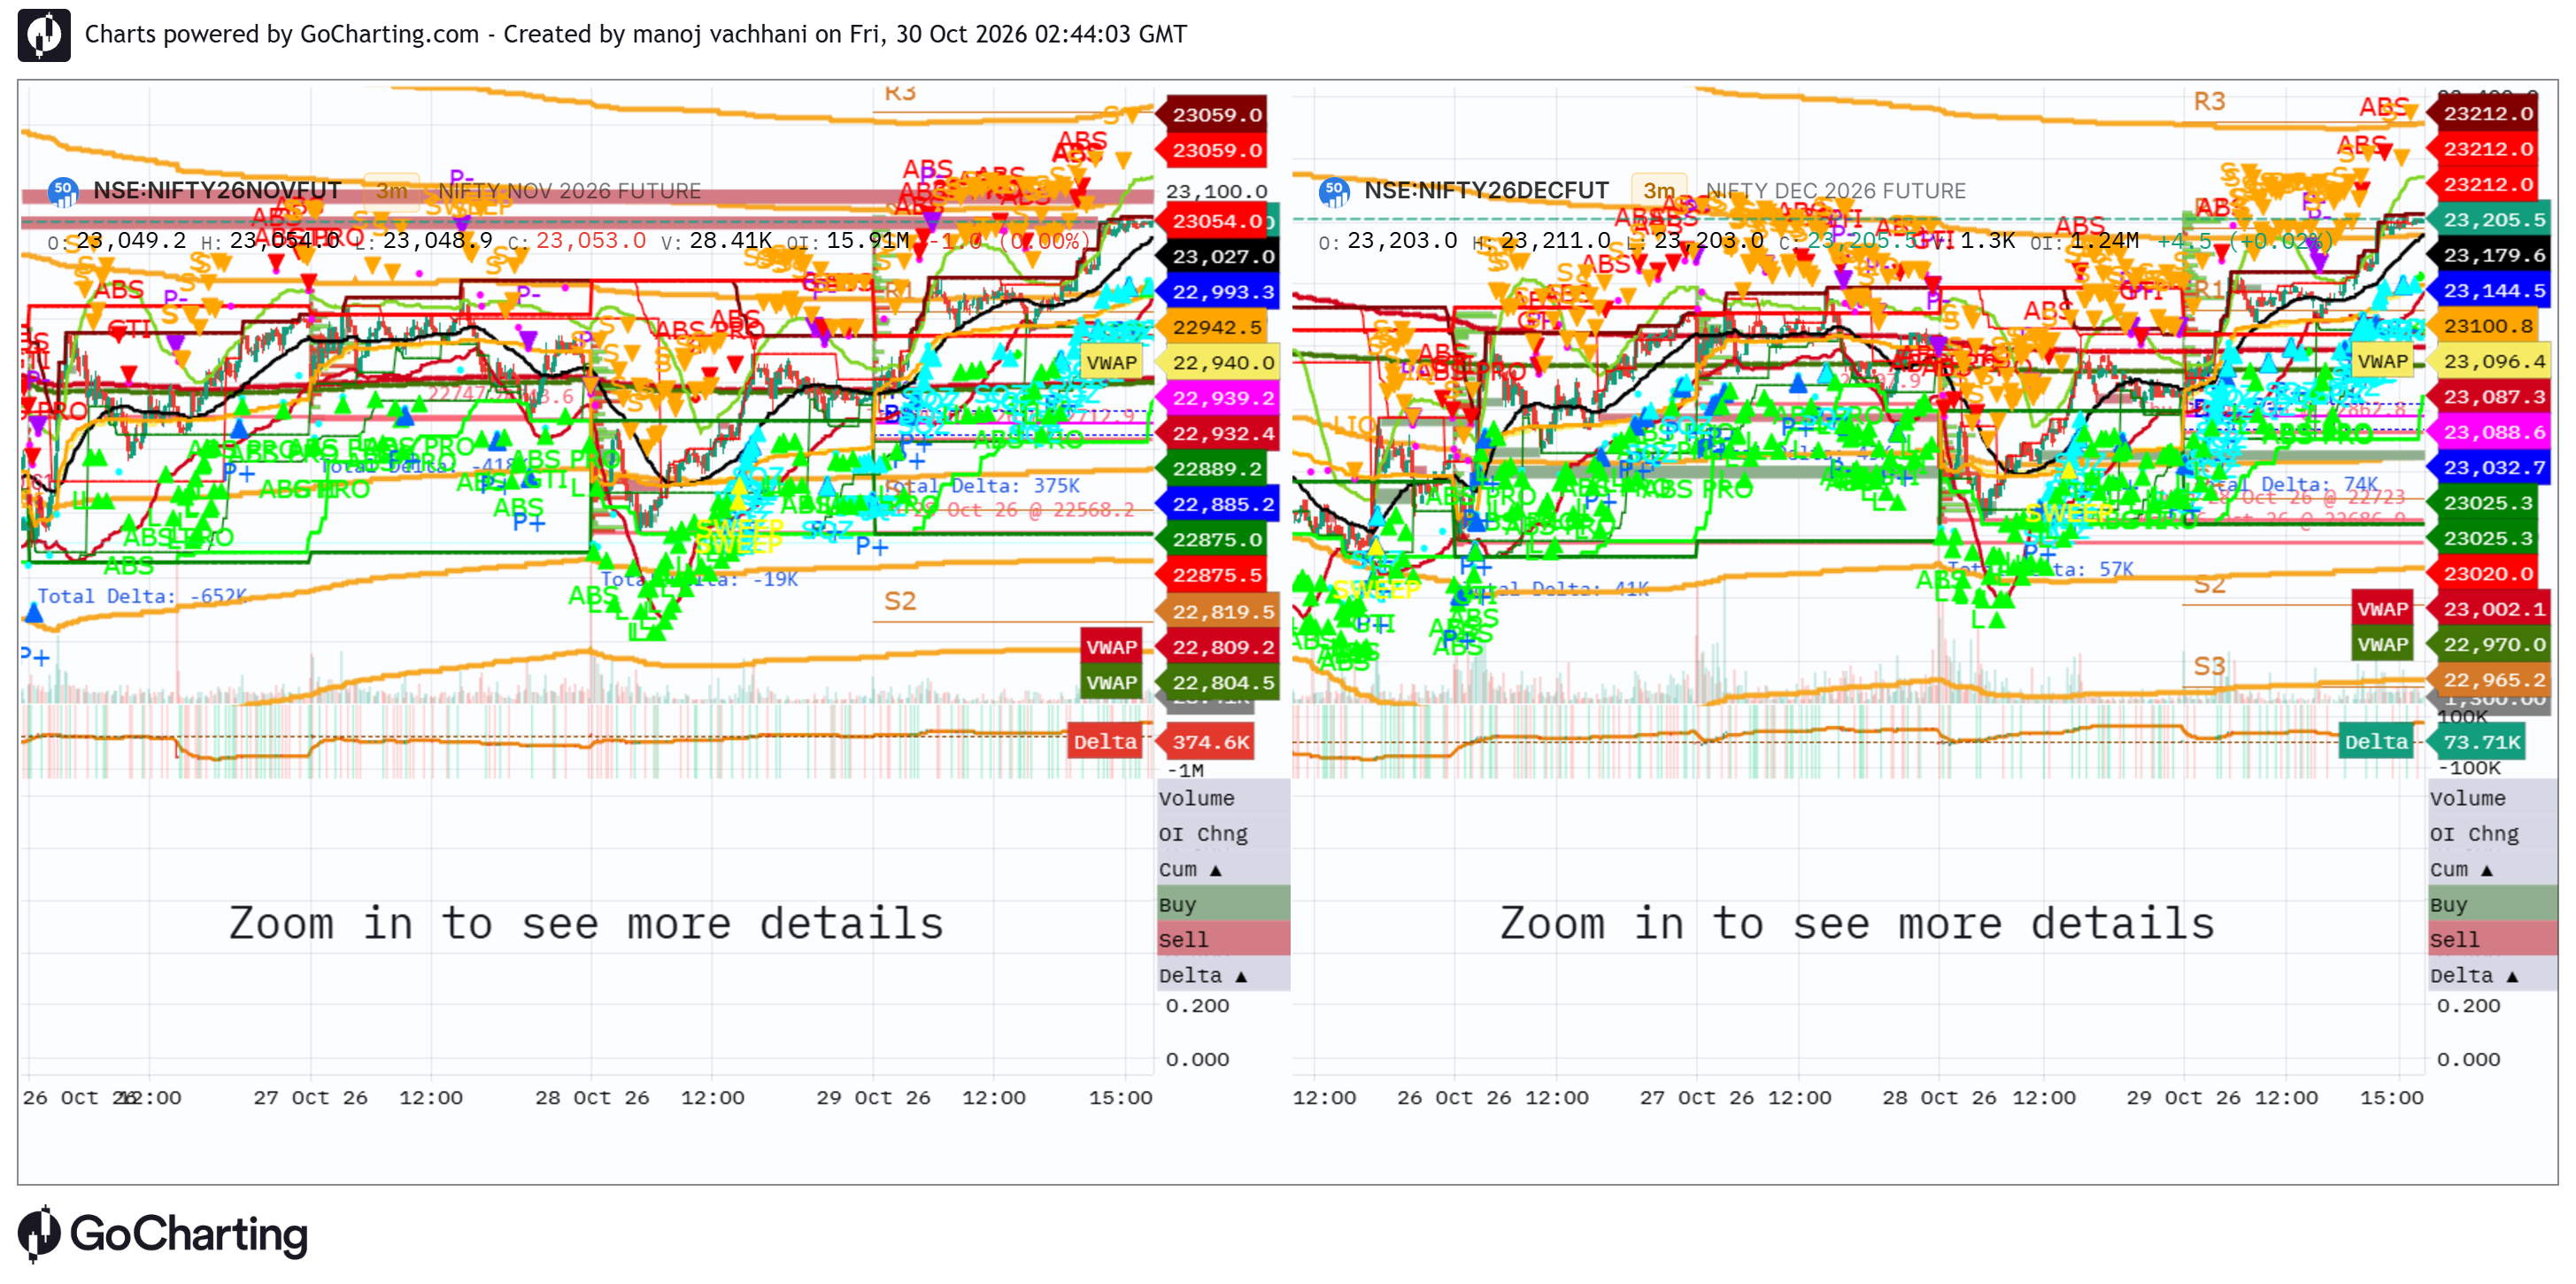
nifty futures two months
this is intitutional grade nifty index futures two months 3 minute chart with lipi script for absorption ( limit orders) and power trades candles...helps to figure out support and registance and helps to play swing trades intraday... below is the lipi sctipt you can apply on the chart . // =============================================================================// GTI_LIPI v7.9.0 CLEAN-CHART HIGH-RELIABILITY (Institutional Order Flow Engine)// Silicon Valley FinTech Quantitative Architecture for GoCharting// =============================================================================// USER GUIDE & QUANTITATIVE ORDER FLOW PLAYBOOK:// -----------------------------------------------------------------------------// 1. WHAT IS THE DIFFERENCE BETWEEN "ABS" AND "ABS PRO"?// - ABS (Bullish Absorption): // * Order Flow Microstructure: Market takers aggressively dump sell orders (Delta // However, institutional PASSIVE LIMIT BIDS absorb 100% of the sell orders without// price breaking down.// * Candle Anatomy: Long lower rejection wick (>= 40% range) or closes green.// * Directional Bias: BULLISH REVERSAL / ACCUMULATION.// - ABS PRO (Bearish Absorption / Supply Wall):// * Order Flow Microstructure: Market takers aggressively chase buy orders (Delta > 0).// However, institutional PASSIVE LIMIT ASKS cap the price ceiling, absorbing all// demand.// * Candle Anatomy: Severe upper rejection wick (>= 40% range) or closes red.// * Directional Bias: BEARISH REVERSAL / SUPPLY REJECTION.//// 2. WHICH SIGNAL IS MORE RELIABLE AND WHY?// - HIGH-RELIABILITY: "ABS" at Structural Floors (S2/S3 Pivots, VWAP -2σ, Prior Day Low).// When heavy selling delta occurs at structural extremes without price progress,// it indicates institutional smart money passive absorption. In today's session,// the green ABS at 54,370 near S3 preceded a +500 point vertical blast!// - LOW-RELIABILITY / NOISE: Mid-Trend "ABS PRO" during a trending descent.// In a strong downtrend below the 100 EMA, minor pauses and tick delta fluctuations// repeatedly trigger false or micro ABS PRO signals along the moving average.// These represent order drift, NOT actionable turning points, and clutter the chart.//// 3. THE v7.9.0 CLEAN-CHART NOISE FILTER:// - "Show High-Reliability Only": Automatically suppresses mid-trend drift noise.// - "Require Confluence": Demands that Bullish ABS ONLY fires at Demand/S2/S3/VWAP Floor,// and Bearish ABS PRO ONLY fires at Supply/R1/R2/Day High Ceiling.// - "Anti-Repeat Cooldown": Blocks consecutive identical arrows within 3 bars,// completely eliminating the 3-4 repeated red triangles in a row.// =============================================================================indicator("GTI_LIPI v7.9.0 Clean", overlay=true)// ===============================// INPUTS & CLEAN-CHART CONTROLS// ===============================filterNoise = input(true, "Hide Less Reliable Noise (Clean Chart)")showReliableOnly = input(true, "High-Reliability Confluence Signals Only")hideMidTrendAbs = input(true, "Hide Mid-Trend Drift Signals (Anti-Clutter)")antiRepeatCooldown = input(true, "Anti-Repeat Cooldown (No Consecutive Arrows)")showAbsBull = input(true, "Show Bullish Absorption (ABS Floor Reversals)")showAbsBear = input(true, "Show Bearish Absorption (ABS PRO Ceiling Only)")showPowerTrades = input(true, "Show Power Trades (P+ / P-)")showLabels = input(true, "Show Text Labels (ABS, P+, etc.)")showDash = input(true, "Show Dashboard")volThreshold = input(1.5, "Inst. Volume Threshold")intThreshold = input(1.2, "Inst. Intensity Threshold")showZones = input(true, "Show Auto-HTF Zones")zoneSensitivity = input(1.0, "Zone Period Scale (1.0 = Default)")showDailySD = input(false, "Show Session VWAP SD Bands (1,2,3)")showWeekly = input(false, "Show Weekly VWAP (5-Day)")showMonthly = input(false, "Show Monthly VWAP (20-Day)")showStructure = input(true, "Show Session Structure (PDH/PDL)")enableAlerts = input(true, "Enable Sound Alerts")dojiThreshold = input(0.3, "ABS Doji Body Ratio Threshold")// Order Flow & Lot Multiplier Settings (Invariant: Ratio works identically on Nifty & Bank Nifty)lotMultiplier = input(1.0, "Lot Multiplier Scale")absRatioThresh = input(1.3, "Limit Absorption Imbalance Ratio")strictPTrade = input(true, "Strict Power Trade (Doji Only)?")absOiMult = input(1.5, "Absorption Multiplier (P+/P-)")showLVTST = input(true, "Show LVT/ST Signals")show3F = input(true, "Show 3-Flag (3F) Signals")proxMult = input(2.0, "LVT/ST Proximity Multiplier (x ATR)")trapVolThreshold = input(0.5, "LVT/ST Low Vol Threshold (x SMA)")// ===============================// AUTO-ADAPTIVE PERIOD ENGINE// ===============================mMult = interval.multipliermDay = 375p4h_val = interval.isintraday ? (240 / mMult) : 1pD_val = interval.isintraday ? (mDay / mMult) : 1pW_val = interval.isintraday ? ((mDay * 5) / mMult) : 5p20D_val = interval.isintraday ? ((mDay * 20) / mMult) : 20p4h = math.max(math.round(p4h_val * zoneSensitivity), 2)pD = math.max(math.round(pD_val * zoneSensitivity), 5)pW = math.max(math.round(pW_val * zoneSensitivity), 10)p20D = math.max(math.round(p20D_val * zoneSensitivity), 20)// ===============================// ORDERFLOW & INTENSITY ENGINE// ===============================rawDelta = nz(orderflow.delta)buyVol = nz(orderflow.buyvolume)sellVol = nz(orderflow.sellvolume)// Reconstruct synthetic delta if footprint feed is pendingsynthDelta = volume * (2 * close - low - high) / math.max(high - low, 0.0001)useActualOF = (nz(talib.sma(math.abs(rawDelta), 10)) > 0)delta = useActualOF ? rawDelta : synthDelta// Derive Limit Orders from Aggressive Market VolumelimitSellVol = useActualOF ? buyVol : math.max(synthDelta, 0)limitBuyVol = useActualOF ? sellVol : math.max(-synthDelta, 0)// Quantity Scaled with Safe Lot Multiplier (Protected against NaN / Zero)safeLotMultiplier = math.max(nz(lotMultiplier, 1.0), 1.0)totalVolumeLots = volume * safeLotMultiplierlimitSellLots = limitSellVol * safeLotMultiplierlimitBuyLots = limitBuyVol * safeLotMultipliernetDeltaLots = delta * safeLotMultipliervolSma = talib.sma(volume, 20)instIntensity = (math.abs(delta) / math.max(volume, 1)) * (volume / math.max(volSma, 1))intensitySma = talib.sma(instIntensity, 20)instMult = instIntensity / math.max(intensitySma, 0.001)hasOI = nz(talib.sma(oi, 14)) > 0oiChange = math.abs(nz(oi) - nz(oi[1]))oiSma = talib.sma(oiChange, 20)oiMult = oiChange / math.max(oiSma, 0.001)volMult = volume / math.max(volSma, 0.001)oiProminent = (instMult > intThreshold) or (hasOI and oiMult > 1.2) or (not hasOI and volMult > 1.8)sigSize = size.tiny// ===============================// NON-REPAINTING AUTO-ZONES// ===============================dzLocal = float(na)szLocal = float(na)dzLocal := (low == talib.lowest(low, 10) and instMult > 1.5) ? low : dzLocal[1]szLocal := (high == talib.highest(high, 10) and instMult > 1.5) ? high : szLocal[1]dz4h = talib.lowest(low, p4h)sz4h = talib.highest(high, p4h)dzD = talib.lowest(low, pD)szD = talib.highest(high, pD)dzW = talib.lowest(low, pW)szW = talib.highest(high, pW)dz20D = talib.lowest(low, p20D)sz20D = talib.highest(high, p20D)plot(dzLocal, "Local Demand", color.new(color.green, 50), 1)plot(szLocal, "Local Supply", color.new(color.red, 50), 1)plot(showZones ? dz4h : na, "Demand 4H", color.green, 1)plot(showZones ? sz4h : na, "Supply 4H", color.red, 1)plot(showZones ? dzD : na, "Demand Day", color.lime, 2)plot(showZones ? szD : na, "Supply Day", color.maroon, 2)plot(showZones ? dzW : na, "Demand Weekly", color.aqua, 2)plot(showZones ? szW : na, "Supply Weekly", color.fuchsia, 2)plot(showZones ? dz20D : na, "Demand 20D", color.white, 2)plot(showZones ? sz20D : na, "Supply 20D", color.orange, 2)// ===============================// TRUE ANCHORED VALUE ENGINE// ===============================isNewDay = dayofweek != dayofweek[1]isNewWeek = dayofweek isNewMonth = month != month[1]// ===============================// CUMULATIVE DELTA FLOW & STRUCTURE// ===============================cumDelta = float(na)cumDelta := isNewDay ? delta : (nz(cumDelta[1]) + delta)cumDeltaSma = talib.ema(cumDelta, 21)isBullFlow = cumDelta > cumDeltaSmaisBearFlow = cumDelta cdh = float(na)cdl = float(na)pdh = float(na)pdl = float(na)cdh := isNewDay or na(cdh[1]) ? high : math.max(cdh[1], high)cdl := isNewDay or na(cdl[1]) ? low : math.min(cdl[1], low)pdh := isNewDay ? cdh[1] : pdh[1]pdl := isNewDay ? cdl[1] : pdl[1]plot(showStructure ? pdh : na, "Prev Day High", color.red, 2)plot(showStructure ? pdl : na, "Prev Day Low", color.green, 2)sumPV_D = 0.0sumV_D = 0.0sumPV2_D = 0.0sumPV_D := isNewDay ? (close * volume) : (nz(sumPV_D[1]) + (close * volume))sumV_D := isNewDay ? volume : (nz(sumV_D[1]) + volume)sumPV2_D := isNewDay ? (close * close * volume) : (nz(sumPV2_D[1]) + (close * close * volume))vwapD = sumPV_D / math.max(sumV_D, 0.001)meanPV2 = sumPV2_D / math.max(sumV_D, 0.001)variance = meanPV2 - (vwapD * vwapD)sdVal = math.sqrt(math.max(variance, 0))plot(vwapD, "Session VWAP", color.orange, 2)plot(showDailySD ? vwapD + sdVal : na, "SD1 Upper", color.new(color.gray, 50), 1)plot(showDailySD ? vwapD - sdVal : na, "SD1 Lower", color.new(color.gray, 50), 1)plot(showDailySD ? vwapD + (sdVal * 2) : na, "SD2 Upper", color.new(color.gray, 70), 1)plot(showDailySD ? vwapD - (sdVal * 2) : na, "SD2 Lower", color.new(color.gray, 70), 1)plot(showDailySD ? vwapD + (sdVal * 3) : na, "SD3 Upper", color.new(color.gray, 85), 1)plot(showDailySD ? vwapD - (sdVal * 3) : na, "SD3 Lower", color.new(color.gray, 85), 1)sumPV_W = 0.0sumV_W = 0.0sumPV_W := isNewWeek ? (close * volume) : (nz(sumPV_W[1]) + (close * volume))sumV_W := isNewWeek ? volume : (nz(sumV_W[1]) + volume)vwapW = sumPV_W / math.max(sumV_W, 0.001)plot(showWeekly ? vwapW : na, "Weekly VWAP", color.yellow, 2)sumPV_M = 0.0sumV_M = 0.0sumPV_M := isNewMonth ? (close * volume) : (nz(sumPV_M[1]) + (close * volume))sumV_M := isNewMonth ? volume : (nz(sumV_M[1]) + volume)vwapM = sumPV_M / math.max(sumV_M, 0.001)plot(showMonthly ? vwapM : na, "Monthly VWAP", color.white, 2)// ===============================// CPR & STRUCTURAL PIVOT GEOMETRY// ===============================pdc = float(na)pdc := isNewDay ? close[1] : pdc[1]pivot = (pdh + pdl + pdc) / 3bc = (pdh + pdl) / 2tc = (pivot - bc) + pivots1 = 2 * pivot - pdhr1 = 2 * pivot - pdls2 = pivot - (pdh - pdl)r2 = pivot + (pdh - pdl)s3 = s1 - (pdh - pdl)r3 = r1 + (pdh - pdl)atr = talib.sma(high - low, 14)proxLimit = atr * proxMult// Structural Demand / Floor ConfluenceisNearLocalD = (low = dzLocal - proxLimit)isNear4hD = (low = dz4h - proxLimit)isNearDayD = (low = dzD - proxLimit)isNearWeekD = (low = dzW - proxLimit)isNearPDL = (low = pdl - proxLimit)isNearS1 = (low = s1 - proxLimit)isNearS2 = (low = s2 - proxLimit)isNearS3 = (low = s3 - proxLimit)isNearVwapSD2_D = (low = (vwapD - sdVal * 2.5) - proxLimit)isNearDemand = nz(isNearLocalD) or nz(isNear4hD) or nz(isNearDayD) or nz(isNearWeekD) or nz(isNearPDL) or nz(isNearS1) or nz(isNearS2) or nz(isNearS3) or nz(isNearVwapSD2_D)// Structural Supply / Ceiling ConfluenceisNearLocalS = (high >= szLocal - proxLimit) and (close isNear4hS = (high >= sz4h - proxLimit) and (close isNearDayS = (high >= szD - proxLimit) and (close isNearWeekS = (high >= szW - proxLimit) and (close isNearPDH = (high >= pdh - proxLimit) and (close isNearR1 = (high >= r1 - proxLimit) and (close isNearR2 = (high >= r2 - proxLimit) and (close isNearR3 = (high >= r3 - proxLimit) and (close isNearVwapSD2_S = (high >= (vwapD + sdVal * 1.5) - proxLimit) and (close isNearSupply = nz(isNearLocalS) or nz(isNear4hS) or nz(isNearDayS) or nz(isNearWeekS) or nz(isNearPDH) or nz(isNearR1) or nz(isNearR2) or nz(isNearR3) or nz(isNearVwapSD2_S)// ===============================// GTI ENGINE (CORE REGIME)// ===============================trendEma = talib.ema(close, 100)isBullRegime = close > trendEmaisBearRegime = close isBlueActivity = (close > open) and (volume > volSma * volThreshold) and oiProminentisRedActivity = (close volSma * volThreshold) and oiProminentplotshape(isBlueActivity and not filterNoise, "Activity ▲", shape.circle, location.belowbar, color.aqua, size=sigSize)plotshape(isRedActivity and not filterNoise, "Activity ▼", shape.circle, location.abovebar, color.fuchsia, size=sigSize)// =============================================================================// REFINED HIGH-RELIABILITY ABSORPTION ENGINE// =============================================================================candleRange = math.max(high - low, 0.0001)bodySize = math.abs(close - open)bodyRatio = bodySize / candleRangeisAbsBody = bodyRatio lowerWick = math.min(open, close) - lowupperWick = high - math.max(open, close)bullAbsWick = lowerWick > candleRange * 0.4 and close > low + candleRange * 0.3bearAbsWick = upperWick > candleRange * 0.4 and close volConfirm = volume > volSma * volThreshold// Limit Order Imbalance Confirmations (Invariant: Identical calculation on Nifty and Bank Nifty)limitBuyAbsorbing = (limitBuyVol > limitSellVol * absRatioThresh) or bullAbsWicklimitSellAbsorbing = (limitSellVol > limitBuyVol * absRatioThresh) or bearAbsWick// 1. Raw Absorption Physics:// Bullish Absorption: Market delta is negative, but Limit Bids absorb selling & price holds/closes greenrawBullAbs = volConfirm and (delta = open or bullAbsWick) and (close >= low + candleRange * 0.4)// Bearish Absorption: Market delta is positive, BUT price FAILS (Closes RED or severe upper rejection wick >= 40%)rawBearAbs = volConfirm and (delta > 0) and limitSellAbsorbing and (close // 2. High-Reliability Structural Confluence Filter:// ABS (Bullish) is highest reliability at Floor S&R (S1/S2/S3/Demand/PDL)isHighReliabilityBullAbs = rawBullAbs and isNearDemand// ABS PRO (Bearish) is ONLY reliable at Ceiling S&R (R1/R2/Supply/PDH). In mid-trend drift, it is NOISE!isHighReliabilityBearAbs = rawBearAbs and isNearSupply// 3. Anti-Clutter Cooldown (No consecutive 3-4 arrows in a row):isBullCooldown = antiRepeatCooldown ? (not rawBullAbs[1] and not rawBullAbs[2]) : trueisBearCooldown = antiRepeatCooldown ? (not rawBearAbs[1] and not rawBearAbs[2]) : true// Final Decision Logic based on User Clean-Chart Controls:// Keep HIGH-RELIABILITY signals; HIDE less reliable mid-trend drift noisefinalBullAbs = showAbsBull and (showReliableOnly ? (isHighReliabilityBullAbs and isBullCooldown) : (rawBullAbs and isBullCooldown))finalBearAbs = showAbsBear and (showReliableOnly ? (isHighReliabilityBearAbs and isBearCooldown) : (hideMidTrendAbs ? (rawBearAbs and isNearSupply and isBearCooldown) : (rawBearAbs and isBearCooldown)))// =============================================================================// CLEAN PLOTTING (PROMINENT SIGNALS, ZERO CLUTTER)// =============================================================================// Bullish Absorption: Plotted cleanly at structural bottoms (e.g. 54,370 S3 Reversal)plotshape(finalBullAbs and showLabels, "ABS (Bullish Absorption) Label ▲", shape.triangleup, location.belowbar, color.lime, text="ABS", size=sigSize)plotshape(finalBullAbs and not showLabels, "ABS (Bullish Absorption) Shape ▲", shape.triangleup, location.belowbar, color.lime, text="", size=sigSize)// Bearish Absorption: Plotted strictly at structural ceilings (R1/R2/Day High), hidden during mid-trend driftplotshape(finalBearAbs and showLabels, "ABS PRO (Bearish Absorption) Label ▼", shape.triangledown, location.abovebar, color.red, text="ABS PRO", size=sigSize)plotshape(finalBearAbs and not showLabels, "ABS PRO (Bearish Absorption) Shape ▼", shape.triangledown, location.abovebar, color.red, text="", size=sigSize)// =============================================================================// POWER TRADE (P+ / P-) LOGIC (FILTERED AGAINST LIMIT TRAPS)// =============================================================================actualIntensity = (math.abs(delta) / math.max(volume, 1)) * (volume / math.max(volSma, 1))actualIntensitySma = talib.sma(actualIntensity, 20)instFilling = (volume > volSma * 1.5) and (actualIntensity > actualIntensitySma * absOiMult)isAbsDojiBody = strictPTrade ? isAbsBody : true// P+ Trigger: Must have positive delta, price must NOT be trapped by Limit Sells, and candle closes strongstrongBullDoji = showPowerTrades and isAbsDojiBody and instFilling and (delta > 0) and (not rawBearAbs) and (close >= (open + candleRange * 0.1))// P- Trigger: Must have negative delta, price must NOT be trapped by Limit Bids, and candle closes weakstrongBearDoji = showPowerTrades and isAbsDojiBody and instFilling and (delta plotshape(strongBullDoji and showLabels, "Power Trade Buy Label (P+)", shape.triangleup, location.belowbar, #0066FF, text="P+", size=size.small)plotshape(strongBullDoji and not showLabels, "Power Trade Buy Shape (P+)", shape.triangleup, location.belowbar, #0066FF, text="", size=size.small)plotshape(strongBearDoji and showLabels, "Power Trade Sell Label (P-)", shape.triangledown, location.abovebar, #AA00FF, text="P-", size=size.small)plotshape(strongBearDoji and not showLabels, "Power Trade Sell Shape (P-)", shape.triangledown, location.abovebar, #AA00FF, text="", size=size.small)// ===============================// LVT & ST RETEST CONFIRMATIONS// ===============================isLVT_Direct = (volume = open)isLVT_Lagged = (volume[1] = open) and (close[1] isLVT = isLVT_Direct or isLVT_LaggedisST_Direct = (volume isST_Lagged = (volume[1] open[1])isST = isST_Direct or isST_LaggedshowLVT = showLVTST and isLVT and isNearDemand and (not filterNoise or not isLVT[1])showST = showLVTST and isST and isNearSupply and (not filterNoise or not isST[1])plotshape(showLVT and showLabels, "LVT Label ▲", shape.triangleup, location.belowbar, color.lime, text="L▲", size=sigSize)plotshape(showLVT and not showLabels, "LVT Shape ▲", shape.triangleup, location.belowbar, color.lime, text="", size=sigSize)plotshape(showST and showLabels, "ST Label ▼", shape.triangledown, location.abovebar, color.orange, text="S▼", size=sigSize)plotshape(showST and not showLabels, "ST Shape ▼", shape.triangledown, location.abovebar, color.orange, text="", size=sigSize)// =============================================================================// ALERTS ENGINE// =============================================================================if enableAlerts and barstate.islast { if finalBullAbs { alert("GTI_LIPI: High-Reliability ABS Bullish Floor Reversal (Limit Bids Defending S2/S3)") } if finalBearAbs { alert("GTI_LIPI: High-Reliability ABS PRO Bearish Ceiling Reversal (Limit Asks Capping Highs)") } if strongBullDoji { alert("GTI_LIPI: Power Trade Buy (P+) Institutional Breakthrough") } if strongBearDoji { alert("GTI_LIPI: Power Trade Sell (P-) Institutional Breakdown") }}alertcondition(finalBullAbs, title="ABS Bull Floor Reversal", message="ABS Bullish Absorption (Floor Support)")alertcondition(finalBearAbs, title="ABS PRO Bear Ceiling Reversal", message="ABS PRO Bearish Absorption (Ceiling Resistance)")alertcondition(strongBullDoji, title="P+ Power Buy", message="P+ Power Buy Breakthrough")alertcondition(strongBearDoji, title="P- Power Sell", message="P- Power Sell Breakdown")
 manoj vachhani·3d ago
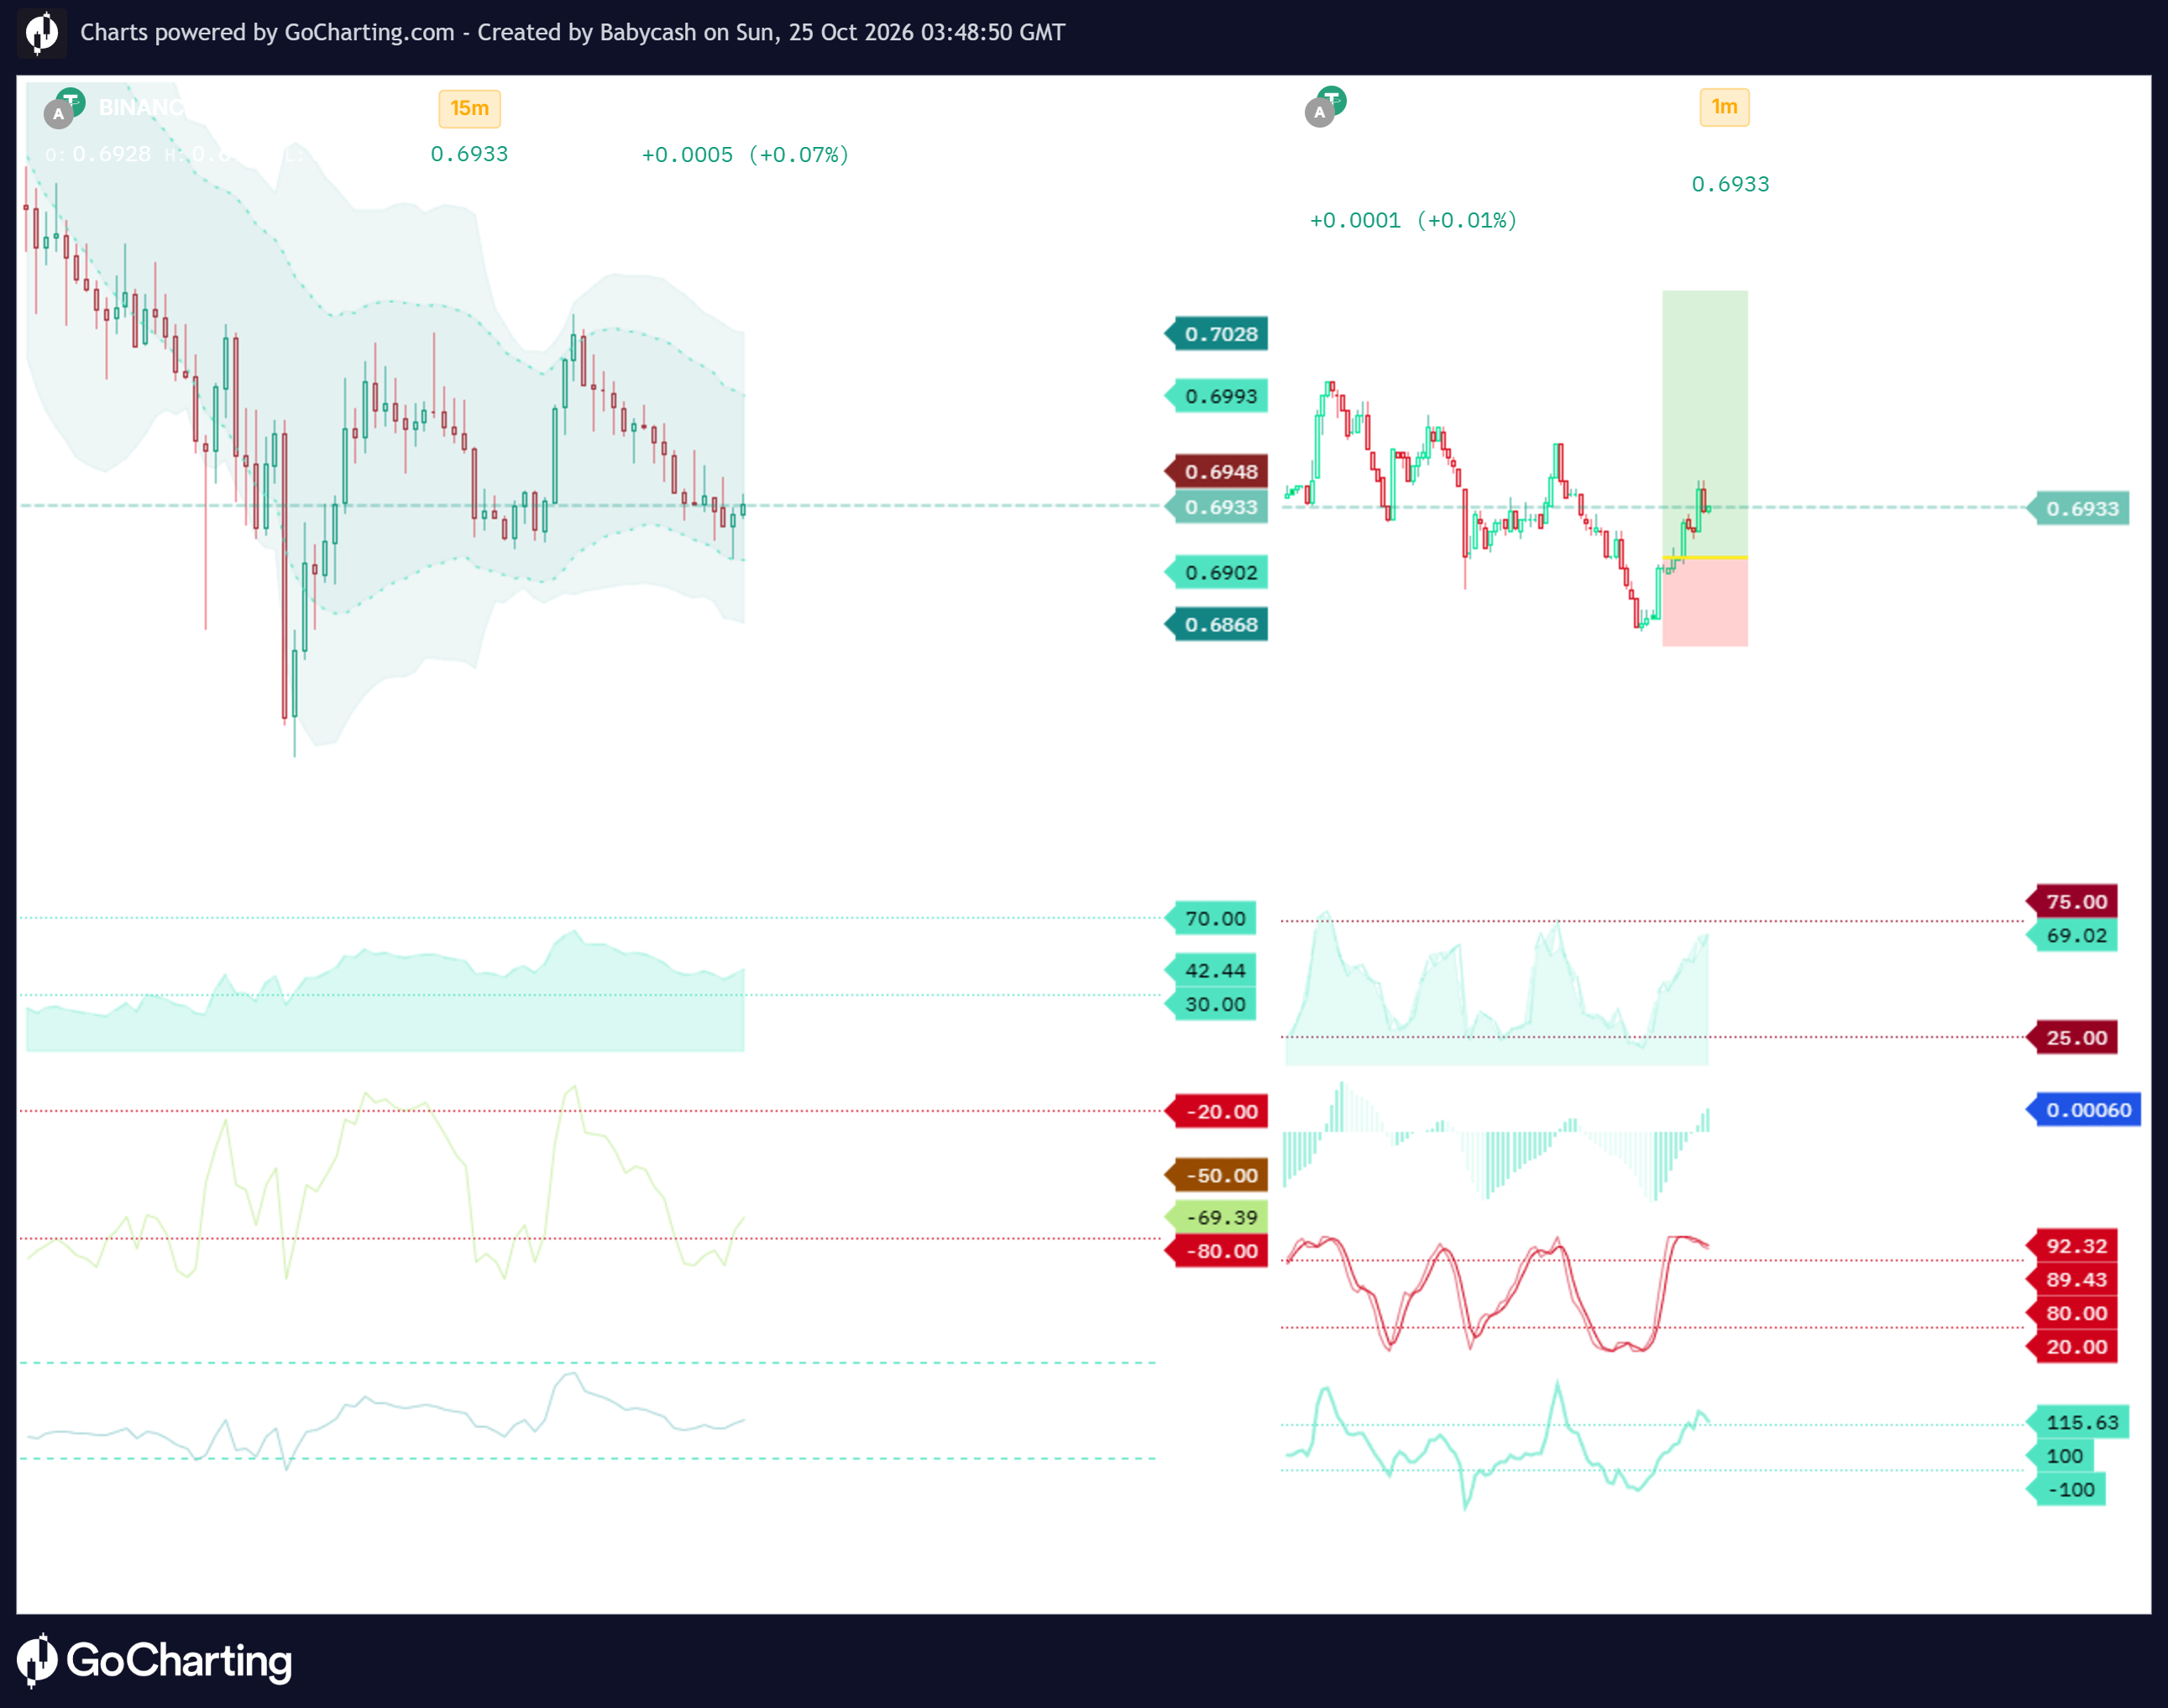
sniper scalping
this is how u scalp , i was on 1 minute and 15 minuntes , we enter on 1 minute after 15 mnute we see extreme drops or sells in the are on 1 minute we see pivot points and we look at osciltors onces prices fixes itself from overbought or overosld we enter and take money
 Babycash·1w ago
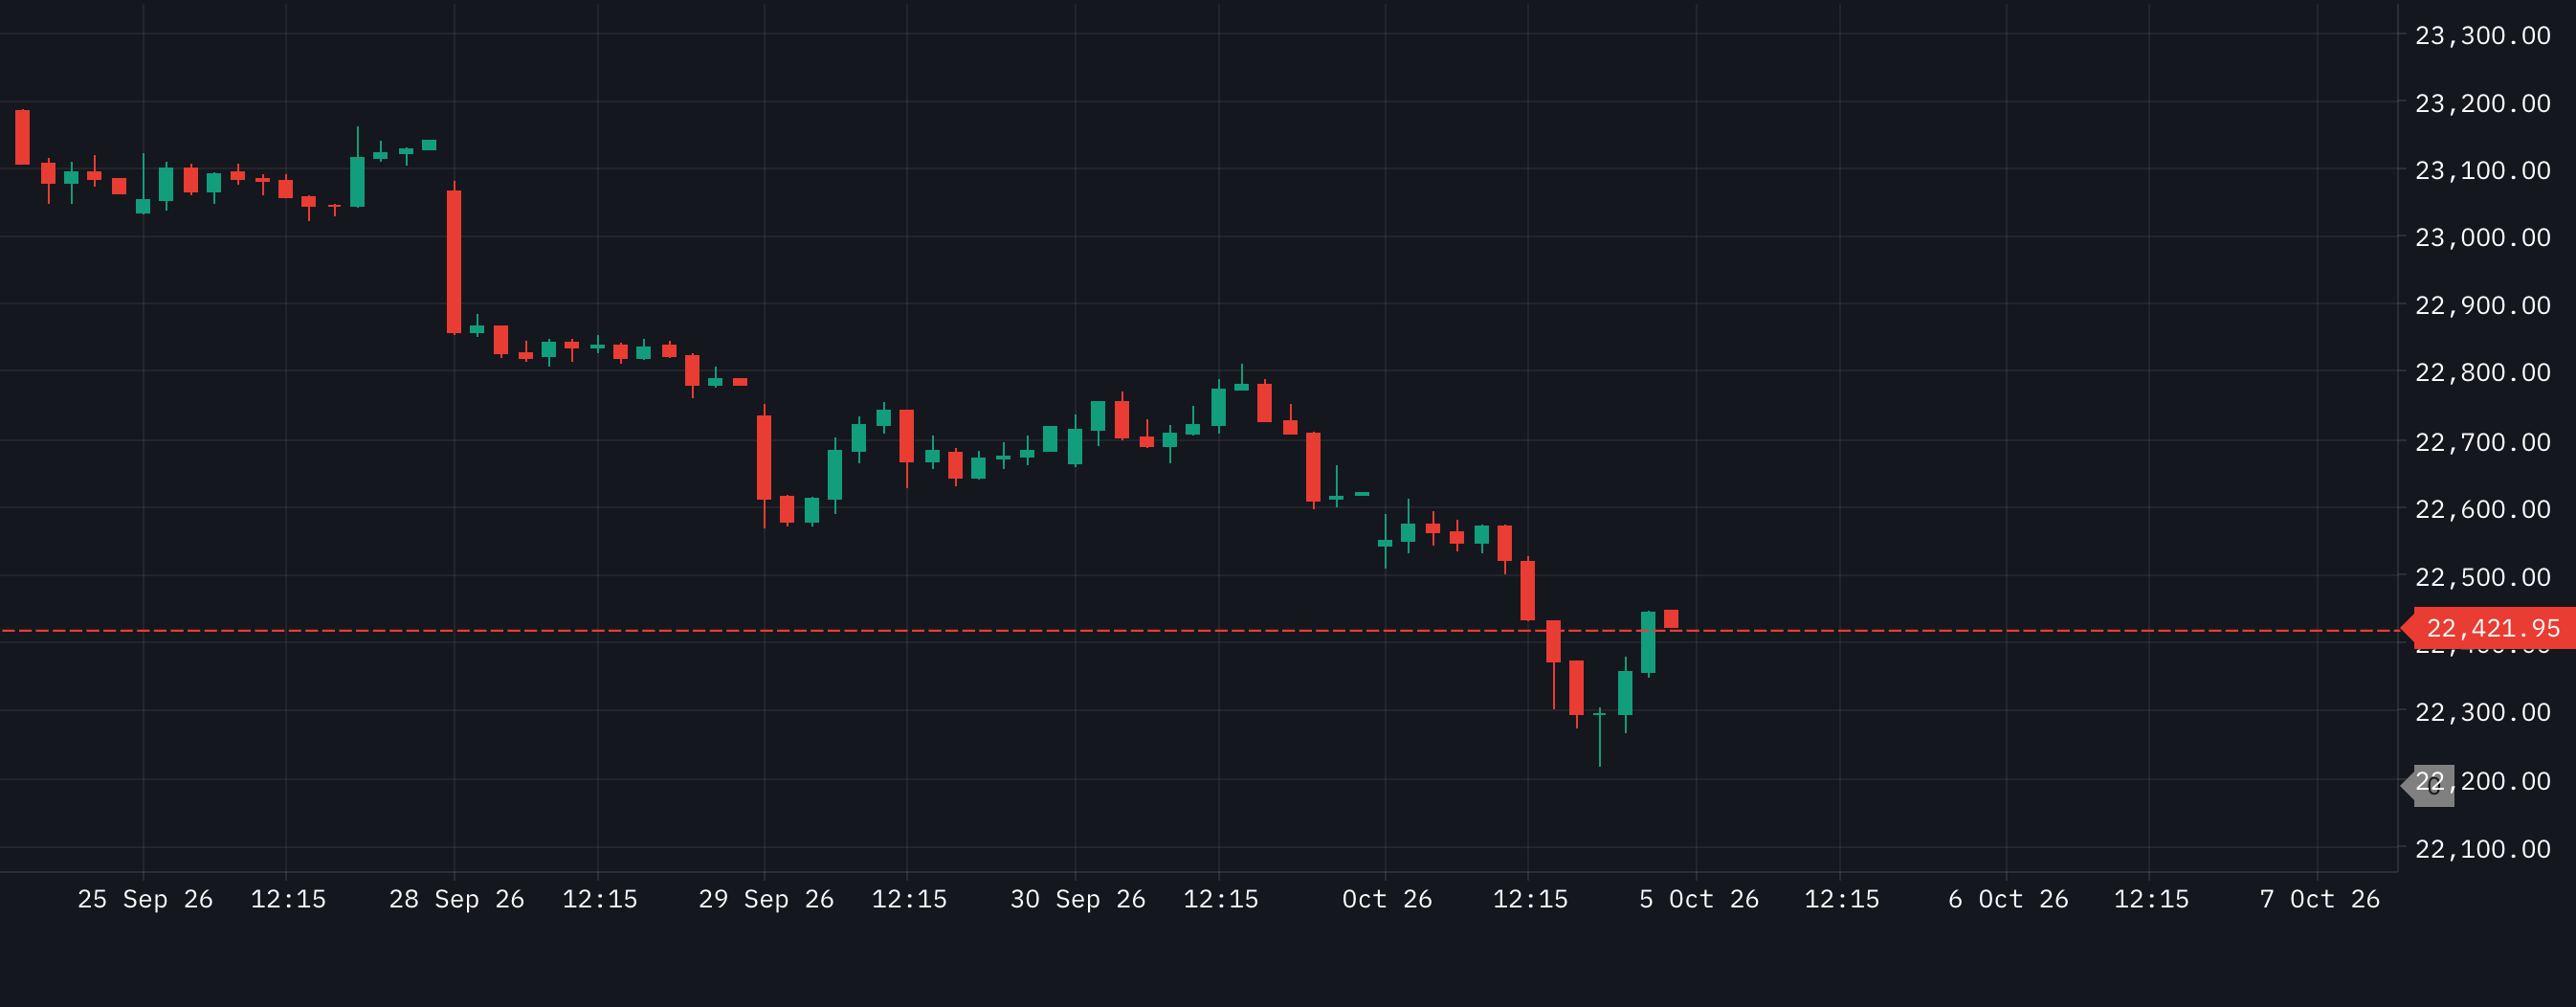
test 4
Lorem ipsum dolor sit amet, consectetur adipiscing elit. Duis eget augue eu ante fermentum interdum sed vitae nisl. Nullam vel vestibulum eros, in tempor turpis. Praesent porta erat libero, quis dictum diam ultrices quis. Vivamus dignissim ante arcu, volutpat vehicula purus aliquam vulputate. Maecenas a lorem quis neque elementum tincidunt. Proin id metus ultricies, semper mi nec, ornare libero. Aliquam fringilla lacinia laoreet. Etiam rhoncus risus vitae purus fermentum lacinia. Mauris dignissim lobortis arcu, a efficitur tellus varius quis. Sed ante dui, tempor vitae diam ac, tempor faucibus sem. Nunc ullamcorper nulla at diam rutrum, a porta lectus dignissim. Maecenas consectetur tristique elit, nec dictum purus mattis at.
 ninja_trader·4w ago
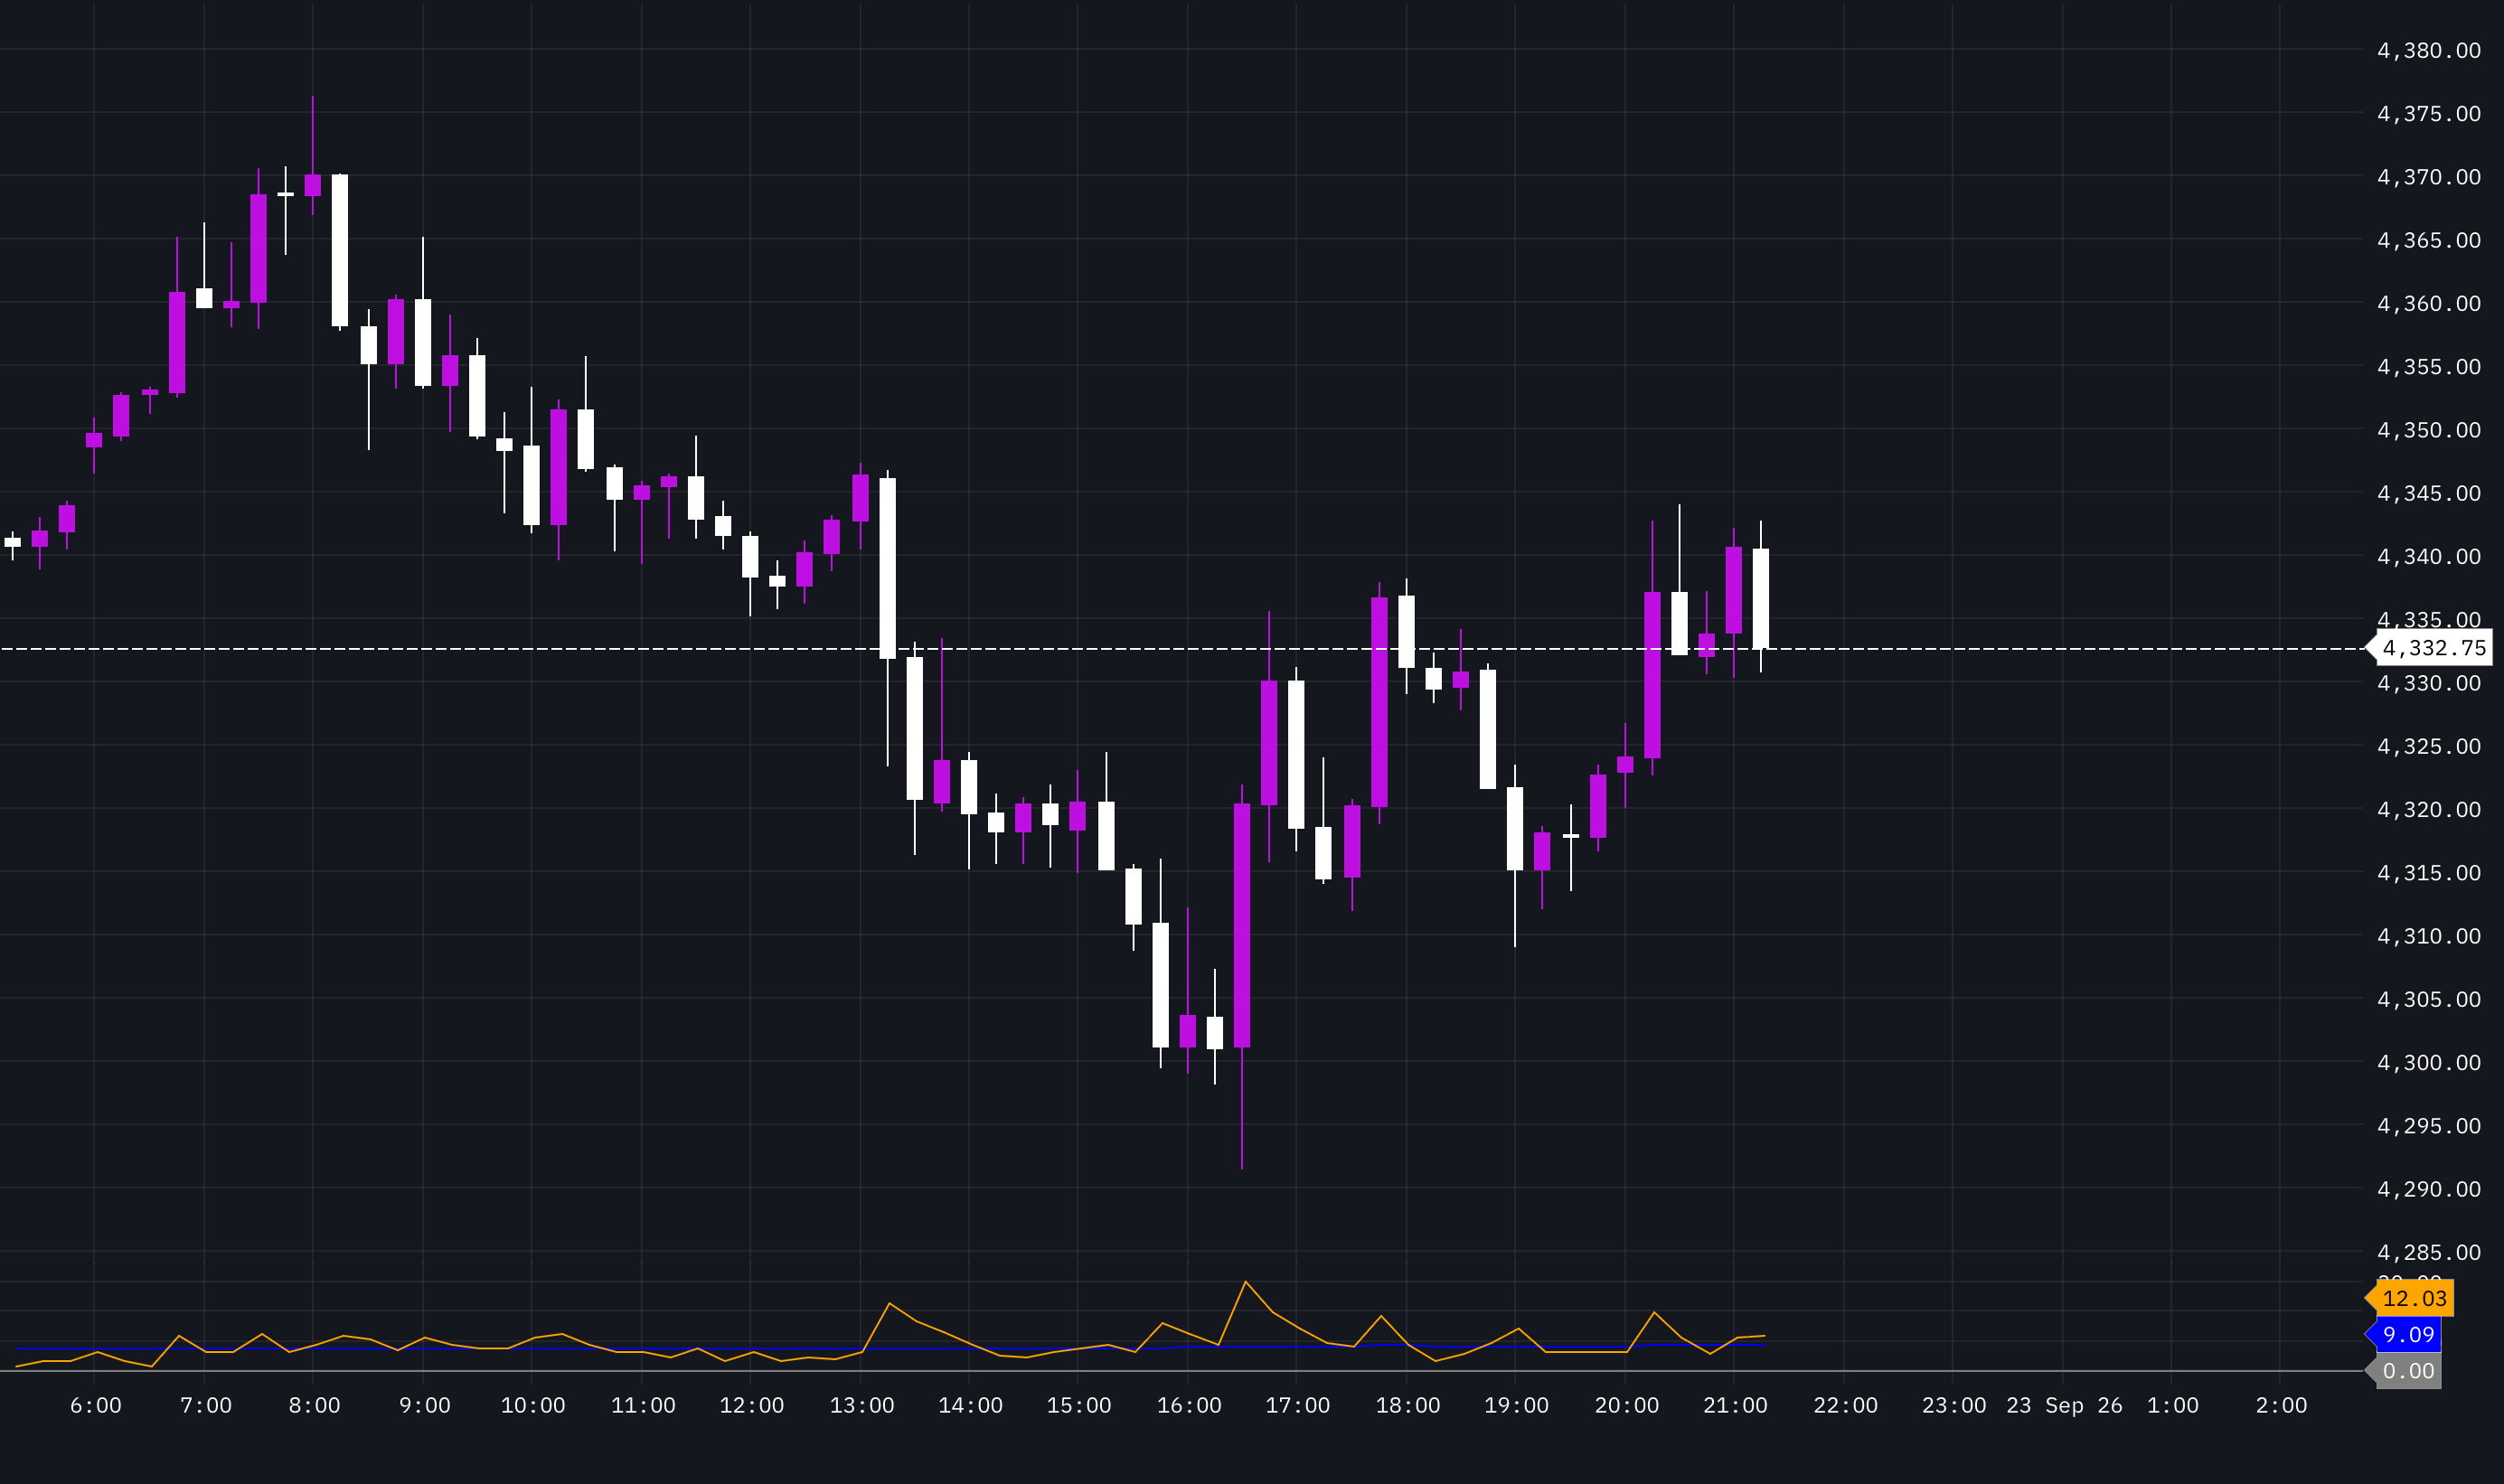
Volatility
This workspace stands as an underlying base for finding out the value area zone, volatility and volume profile (Tick) for tracking Developing point of control
 chitra suresh·1mo ago
NiftyProfileByManish
HI, This layout is a two window profile. It will cover orderflow and volume profile windows in two windows for the same stock/index. Also the settings have been applied as per nifty. In order to correct the blocksize for any other stock/index, calculate the box size to be 0.01% of stock's value and according put the value in block parameter.
 MANISH·1mo ago

Test market profile
I use this has a session market profile for NASDAQ, ES, GC It's a simple market profile with a two tone light color and a lighter borderd volume profile.
 Chiranjeev Verma·2mo ago

Rajeshwari
testinggggggggggggggggggggggggggggggggggggggggggggggggggggggggggggggggggggggggggggggggggggggggggggggggggggggggggggggggggggggggggggggggggggggggggggggggggggg
 Mohan Nayak·2mo ago

Default Chart Layout
Lets see we wnat to put Lets see we wnat to put Lets see we wnat to put Lets see we wnat to put Lets see we wnat to put Lets see we wnat to put Lets see we wnat to put
 DevKiller123·4mo ago

ba
aaaaaaaaaaaaaaaaaaaaaaaaaaaaaaaaaaaaaaaaaaaaaaaaaaaaaaaaaaaaaaaaaaaaaaaaaaaaaaaaaaaaaaaaaaaaaaaaaaaaaaaaaaaaaaaaaaaaaaaaaaaaaaaaaaaaaaaaaaaaaaaaaaaaaaaaaaaaaaaa
Mohan Nayak·5mo ago
Test The Workspace
Get it done
DevKiller123·5mo ago