nifty futures two months

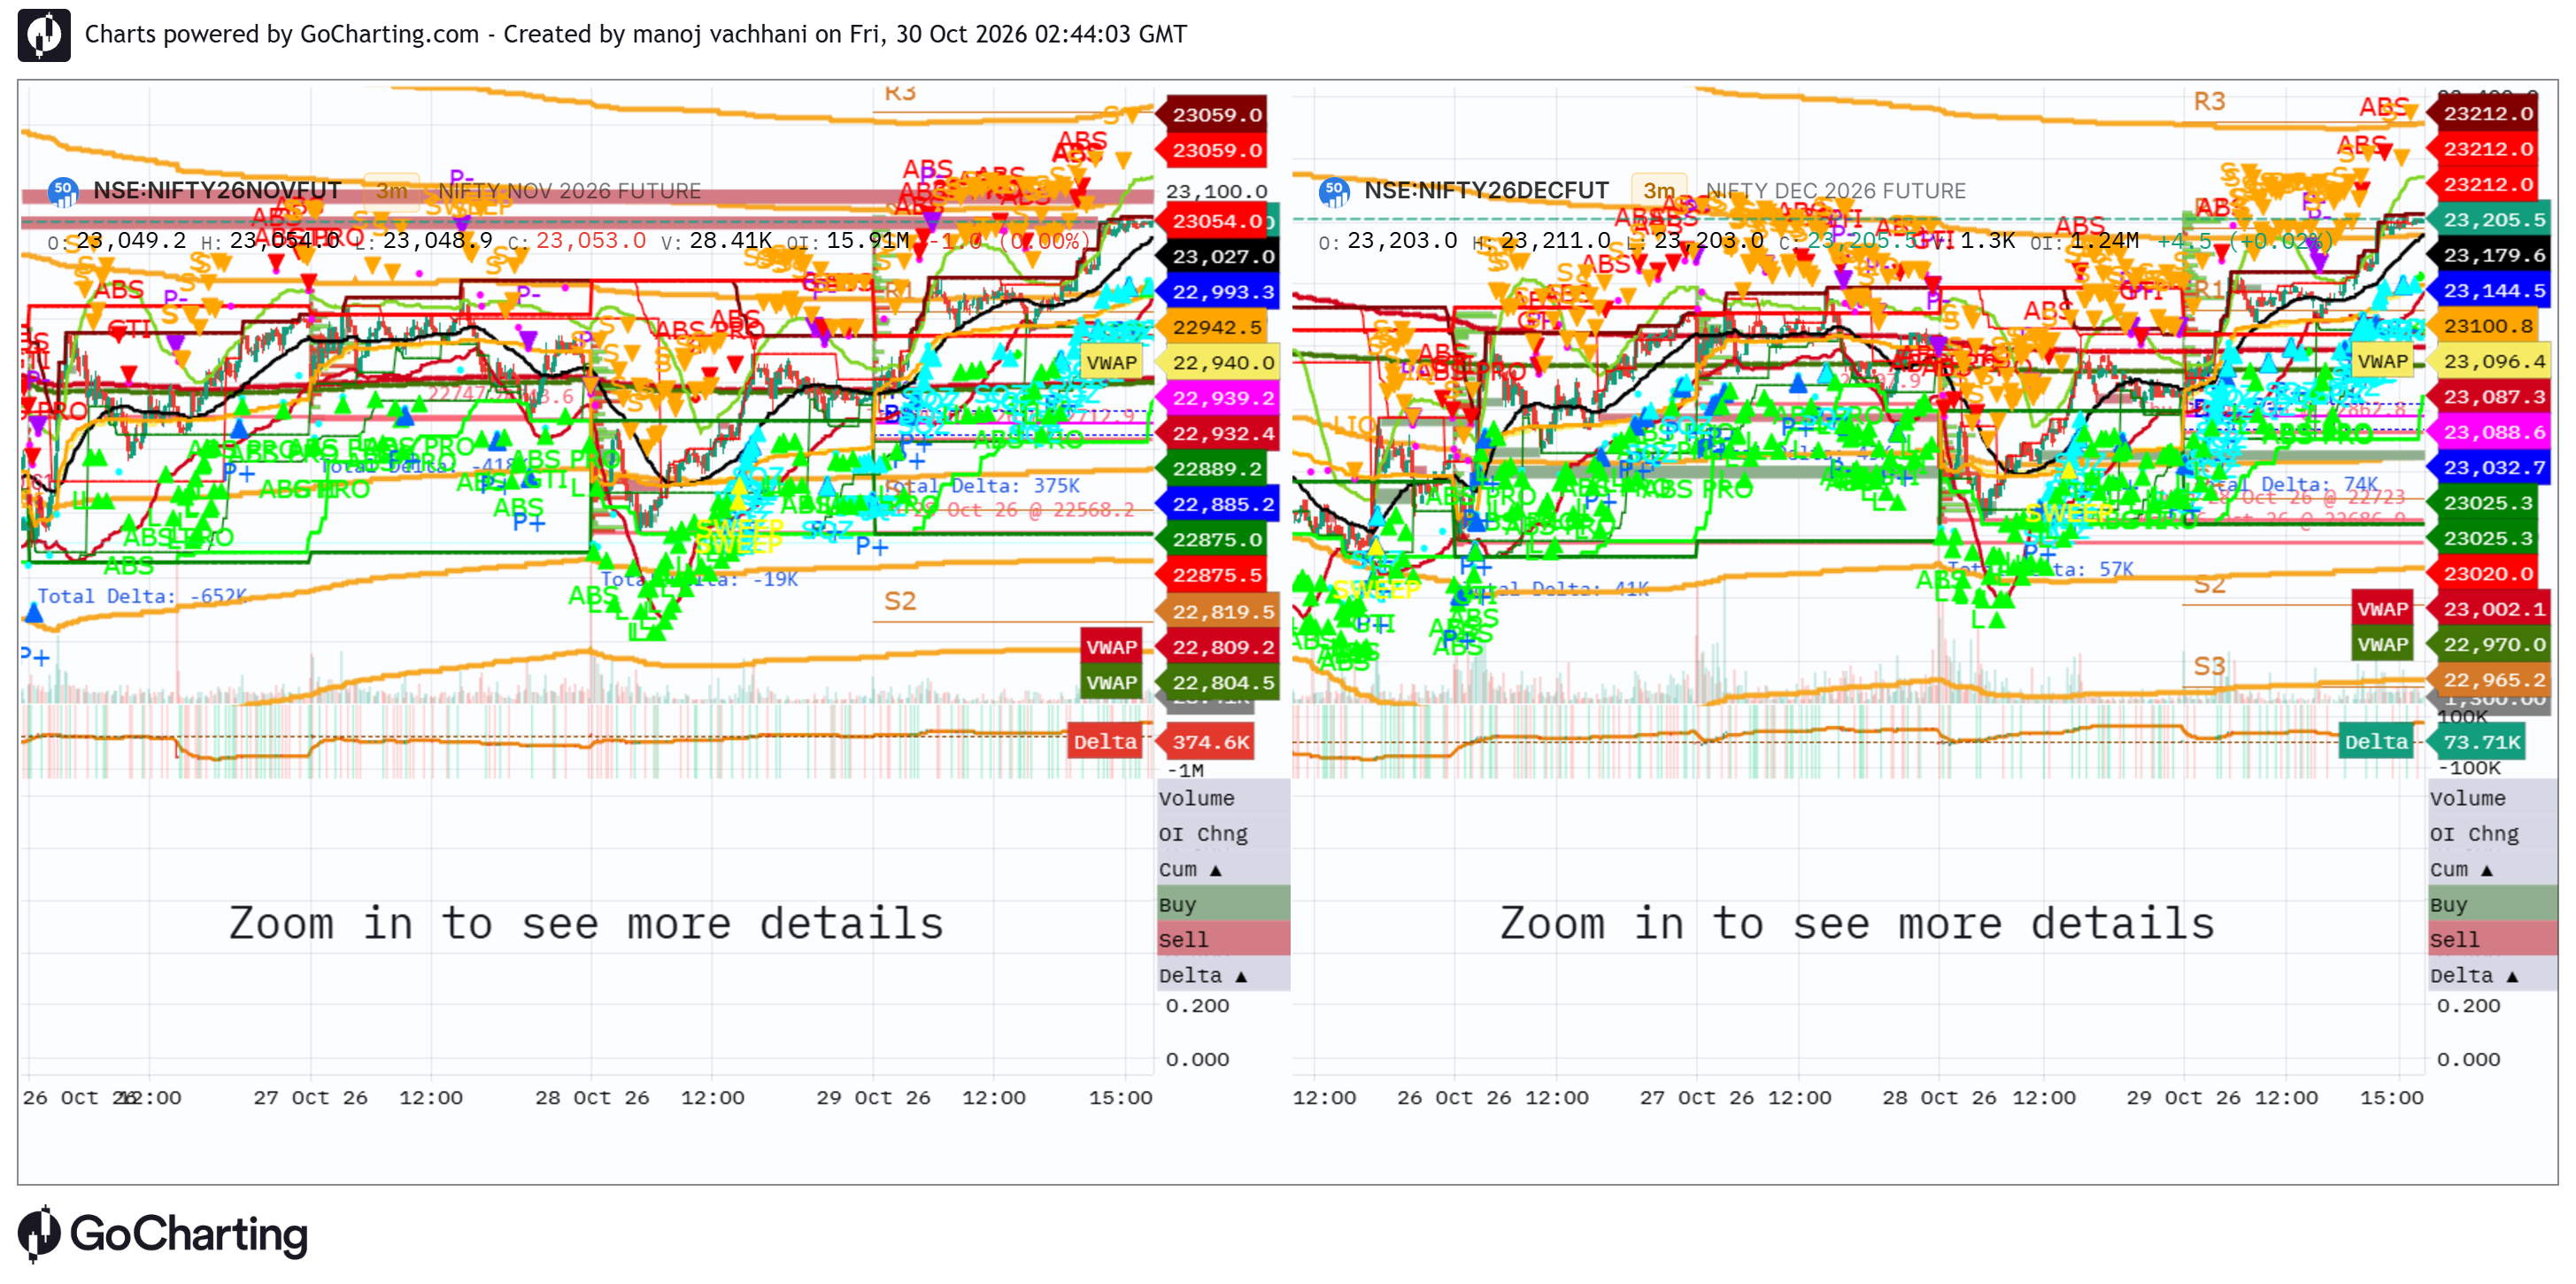
this is intitutional grade nifty index futures two months 3 minute chart with lipi script for absorption ( limit orders) and power trades candles...helps to figure out support and registance and helps to play swing trades intraday... below is the lipi sctipt you can apply on the chart .
// =============================================================================
// GTI_LIPI v7.9.0 CLEAN-CHART HIGH-RELIABILITY (Institutional Order Flow Engine)
// Silicon Valley FinTech Quantitative Architecture for GoCharting
// =============================================================================
// USER GUIDE & QUANTITATIVE ORDER FLOW PLAYBOOK:
// -----------------------------------------------------------------------------
// 1. WHAT IS THE DIFFERENCE BETWEEN "ABS" AND "ABS PRO"?
// - ABS (Bullish Absorption):
// * Order Flow Microstructure: Market takers aggressively dump sell orders (Delta < 0).
// However, institutional PASSIVE LIMIT BIDS absorb 100% of the sell orders without
// price breaking down.
// * Candle Anatomy: Long lower rejection wick (>= 40% range) or closes green.
// * Directional Bias: BULLISH REVERSAL / ACCUMULATION.
// - ABS PRO (Bearish Absorption / Supply Wall):
// * Order Flow Microstructure: Market takers aggressively chase buy orders (Delta > 0).
// However, institutional PASSIVE LIMIT ASKS cap the price ceiling, absorbing all
// demand.
// * Candle Anatomy: Severe upper rejection wick (>= 40% range) or closes red.
// * Directional Bias: BEARISH REVERSAL / SUPPLY REJECTION.
//
// 2. WHICH SIGNAL IS MORE RELIABLE AND WHY?
// - HIGH-RELIABILITY: "ABS" at Structural Floors (S2/S3 Pivots, VWAP -2σ, Prior Day Low).
// When heavy selling delta occurs at structural extremes without price progress,
// it indicates institutional smart money passive absorption. In today's session,
// the green ABS at 54,370 near S3 preceded a +500 point vertical blast!
// - LOW-RELIABILITY / NOISE: Mid-Trend "ABS PRO" during a trending descent.
// In a strong downtrend below the 100 EMA, minor pauses and tick delta fluctuations
// repeatedly trigger false or micro ABS PRO signals along the moving average.
// These represent order drift, NOT actionable turning points, and clutter the chart.
//
// 3. THE v7.9.0 CLEAN-CHART NOISE FILTER:
// - "Show High-Reliability Only": Automatically suppresses mid-trend drift noise.
// - "Require Confluence": Demands that Bullish ABS ONLY fires at Demand/S2/S3/VWAP Floor,
// and Bearish ABS PRO ONLY fires at Supply/R1/R2/Day High Ceiling.
// - "Anti-Repeat Cooldown": Blocks consecutive identical arrows within 3 bars,
// completely eliminating the 3-4 repeated red triangles in a row.
// =============================================================================
indicator("GTI_LIPI v7.9.0 Clean", overlay=true)
// ===============================
// INPUTS & CLEAN-CHART CONTROLS
// ===============================
filterNoise = input(true, "Hide Less Reliable Noise (Clean Chart)")
showReliableOnly = input(true, "High-Reliability Confluence Signals Only")
hideMidTrendAbs = input(true, "Hide Mid-Trend Drift Signals (Anti-Clutter)")
antiRepeatCooldown = input(true, "Anti-Repeat Cooldown (No Consecutive Arrows)")
showAbsBull = input(true, "Show Bullish Absorption (ABS Floor Reversals)")
showAbsBear = input(true, "Show Bearish Absorption (ABS PRO Ceiling Only)")
showPowerTrades = input(true, "Show Power Trades (P+ / P-)")
showLabels = input(true, "Show Text Labels (ABS, P+, etc.)")
showDash = input(true, "Show Dashboard")
volThreshold = input(1.5, "Inst. Volume Threshold")
intThreshold = input(1.2, "Inst. Intensity Threshold")
showZones = input(true, "Show Auto-HTF Zones")
zoneSensitivity = input(1.0, "Zone Period Scale (1.0 = Default)")
showDailySD = input(false, "Show Session VWAP SD Bands (1,2,3)")
showWeekly = input(false, "Show Weekly VWAP (5-Day)")
showMonthly = input(false, "Show Monthly VWAP (20-Day)")
showStructure = input(true, "Show Session Structure (PDH/PDL)")
enableAlerts = input(true, "Enable Sound Alerts")
dojiThreshold = input(0.3, "ABS Doji Body Ratio Threshold")
// Order Flow & Lot Multiplier Settings (Invariant: Ratio works identically on Nifty & Bank Nifty)
lotMultiplier = input(1.0, "Lot Multiplier Scale")
absRatioThresh = input(1.3, "Limit Absorption Imbalance Ratio")
strictPTrade = input(true, "Strict Power Trade (Doji Only)?")
absOiMult = input(1.5, "Absorption Multiplier (P+/P-)")
showLVTST = input(true, "Show LVT/ST Signals")
show3F = input(true, "Show 3-Flag (3F) Signals")
proxMult = input(2.0, "LVT/ST Proximity Multiplier (x ATR)")
trapVolThreshold = input(0.5, "LVT/ST Low Vol Threshold (x SMA)")
// ===============================
// AUTO-ADAPTIVE PERIOD ENGINE
// ===============================
mMult = interval.multiplier
mDay = 375
p4h_val = interval.isintraday ? (240 / mMult) : 1
pD_val = interval.isintraday ? (mDay / mMult) : 1
pW_val = interval.isintraday ? ((mDay * 5) / mMult) : 5
p20D_val = interval.isintraday ? ((mDay * 20) / mMult) : 20
p4h = math.max(math.round(p4h_val * zoneSensitivity), 2)
pD = math.max(math.round(pD_val * zoneSensitivity), 5)
pW = math.max(math.round(pW_val * zoneSensitivity), 10)
p20D = math.max(math.round(p20D_val * zoneSensitivity), 20)
// ===============================
// ORDERFLOW & INTENSITY ENGINE
// ===============================
rawDelta = nz(orderflow.delta)
buyVol = nz(orderflow.buyvolume)
sellVol = nz(orderflow.sellvolume)
// Reconstruct synthetic delta if footprint feed is pending
synthDelta = volume * (2 * close - low - high) / math.max(high - low, 0.0001)
useActualOF = (nz(talib.sma(math.abs(rawDelta), 10)) > 0)
delta = useActualOF ? rawDelta : synthDelta
// Derive Limit Orders from Aggressive Market Volume
limitSellVol = useActualOF ? buyVol : math.max(synthDelta, 0)
limitBuyVol = useActualOF ? sellVol : math.max(-synthDelta, 0)
// Quantity Scaled with Safe Lot Multiplier (Protected against NaN / Zero)
safeLotMultiplier = math.max(nz(lotMultiplier, 1.0), 1.0)
totalVolumeLots = volume * safeLotMultiplier
limitSellLots = limitSellVol * safeLotMultiplier
limitBuyLots = limitBuyVol * safeLotMultiplier
netDeltaLots = delta * safeLotMultiplier
volSma = talib.sma(volume, 20)
instIntensity = (math.abs(delta) / math.max(volume, 1)) * (volume / math.max(volSma, 1))
intensitySma = talib.sma(instIntensity, 20)
instMult = instIntensity / math.max(intensitySma, 0.001)
hasOI = nz(talib.sma(oi, 14)) > 0
oiChange = math.abs(nz(oi) - nz(oi[1]))
oiSma = talib.sma(oiChange, 20)
oiMult = oiChange / math.max(oiSma, 0.001)
volMult = volume / math.max(volSma, 0.001)
oiProminent = (instMult > intThreshold) or (hasOI and oiMult > 1.2) or (not hasOI and volMult > 1.8)
sigSize = size.tiny
// ===============================
// NON-REPAINTING AUTO-ZONES
// ===============================
dzLocal = float(na)
szLocal = float(na)
dzLocal := (low == talib.lowest(low, 10) and instMult > 1.5) ? low : dzLocal[1]
szLocal := (high == talib.highest(high, 10) and instMult > 1.5) ? high : szLocal[1]
dz4h = talib.lowest(low, p4h)
sz4h = talib.highest(high, p4h)
dzD = talib.lowest(low, pD)
szD = talib.highest(high, pD)
dzW = talib.lowest(low, pW)
szW = talib.highest(high, pW)
dz20D = talib.lowest(low, p20D)
sz20D = talib.highest(high, p20D)
plot(dzLocal, "Local Demand", color.new(color.green, 50), 1)
plot(szLocal, "Local Supply", color.new(color.red, 50), 1)
plot(showZones ? dz4h : na, "Demand 4H", color.green, 1)
plot(showZones ? sz4h : na, "Supply 4H", color.red, 1)
plot(showZones ? dzD : na, "Demand Day", color.lime, 2)
plot(showZones ? szD : na, "Supply Day", color.maroon, 2)
plot(showZones ? dzW : na, "Demand Weekly", color.aqua, 2)
plot(showZones ? szW : na, "Supply Weekly", color.fuchsia, 2)
plot(showZones ? dz20D : na, "Demand 20D", color.white, 2)
plot(showZones ? sz20D : na, "Supply 20D", color.orange, 2)
// ===============================
// TRUE ANCHORED VALUE ENGINE
// ===============================
isNewDay = dayofweek != dayofweek[1]
isNewWeek = dayofweek < dayofweek[1]
isNewMonth = month != month[1]
// ===============================
// CUMULATIVE DELTA FLOW & STRUCTURE
// ===============================
cumDelta = float(na)
cumDelta := isNewDay ? delta : (nz(cumDelta[1]) + delta)
cumDeltaSma = talib.ema(cumDelta, 21)
isBullFlow = cumDelta > cumDeltaSma
isBearFlow = cumDelta < cumDeltaSma
cdh = float(na)
cdl = float(na)
pdh = float(na)
pdl = float(na)
cdh := isNewDay or na(cdh[1]) ? high : math.max(cdh[1], high)
cdl := isNewDay or na(cdl[1]) ? low : math.min(cdl[1], low)
pdh := isNewDay ? cdh[1] : pdh[1]
pdl := isNewDay ? cdl[1] : pdl[1]
plot(showStructure ? pdh : na, "Prev Day High", color.red, 2)
plot(showStructure ? pdl : na, "Prev Day Low", color.green, 2)
sumPV_D = 0.0
sumV_D = 0.0
sumPV2_D = 0.0
sumPV_D := isNewDay ? (close * volume) : (nz(sumPV_D[1]) + (close * volume))
sumV_D := isNewDay ? volume : (nz(sumV_D[1]) + volume)
sumPV2_D := isNewDay ? (close * close * volume) : (nz(sumPV2_D[1]) + (close * close * volume))
vwapD = sumPV_D / math.max(sumV_D, 0.001)
meanPV2 = sumPV2_D / math.max(sumV_D, 0.001)
variance = meanPV2 - (vwapD * vwapD)
sdVal = math.sqrt(math.max(variance, 0))
plot(vwapD, "Session VWAP", color.orange, 2)
plot(showDailySD ? vwapD + sdVal : na, "SD1 Upper", color.new(color.gray, 50), 1)
plot(showDailySD ? vwapD - sdVal : na, "SD1 Lower", color.new(color.gray, 50), 1)
plot(showDailySD ? vwapD + (sdVal * 2) : na, "SD2 Upper", color.new(color.gray, 70), 1)
plot(showDailySD ? vwapD - (sdVal * 2) : na, "SD2 Lower", color.new(color.gray, 70), 1)
plot(showDailySD ? vwapD + (sdVal * 3) : na, "SD3 Upper", color.new(color.gray, 85), 1)
plot(showDailySD ? vwapD - (sdVal * 3) : na, "SD3 Lower", color.new(color.gray, 85), 1)
sumPV_W = 0.0
sumV_W = 0.0
sumPV_W := isNewWeek ? (close * volume) : (nz(sumPV_W[1]) + (close * volume))
sumV_W := isNewWeek ? volume : (nz(sumV_W[1]) + volume)
vwapW = sumPV_W / math.max(sumV_W, 0.001)
plot(showWeekly ? vwapW : na, "Weekly VWAP", color.yellow, 2)
sumPV_M = 0.0
sumV_M = 0.0
sumPV_M := isNewMonth ? (close * volume) : (nz(sumPV_M[1]) + (close * volume))
sumV_M := isNewMonth ? volume : (nz(sumV_M[1]) + volume)
vwapM = sumPV_M / math.max(sumV_M, 0.001)
plot(showMonthly ? vwapM : na, "Monthly VWAP", color.white, 2)
// ===============================
// CPR & STRUCTURAL PIVOT GEOMETRY
// ===============================
pdc = float(na)
pdc := isNewDay ? close[1] : pdc[1]
pivot = (pdh + pdl + pdc) / 3
bc = (pdh + pdl) / 2
tc = (pivot - bc) + pivot
s1 = 2 * pivot - pdh
r1 = 2 * pivot - pdl
s2 = pivot - (pdh - pdl)
r2 = pivot + (pdh - pdl)
s3 = s1 - (pdh - pdl)
r3 = r1 + (pdh - pdl)
atr = talib.sma(high - low, 14)
proxLimit = atr * proxMult
// Structural Demand / Floor Confluence
isNearLocalD = (low <= dzLocal + proxLimit) and (close >= dzLocal - proxLimit)
isNear4hD = (low <= dz4h + proxLimit) and (close >= dz4h - proxLimit)
isNearDayD = (low <= dzD + proxLimit) and (close >= dzD - proxLimit)
isNearWeekD = (low <= dzW + proxLimit) and (close >= dzW - proxLimit)
isNearPDL = (low <= pdl + proxLimit) and (close >= pdl - proxLimit)
isNearS1 = (low <= s1 + proxLimit) and (close >= s1 - proxLimit)
isNearS2 = (low <= s2 + proxLimit) and (close >= s2 - proxLimit)
isNearS3 = (low <= s3 + proxLimit) and (close >= s3 - proxLimit)
isNearVwapSD2_D = (low <= (vwapD - sdVal * 1.5) + proxLimit) and (close >= (vwapD - sdVal * 2.5) - proxLimit)
isNearDemand = nz(isNearLocalD) or nz(isNear4hD) or nz(isNearDayD) or nz(isNearWeekD) or nz(isNearPDL) or nz(isNearS1) or nz(isNearS2) or nz(isNearS3) or nz(isNearVwapSD2_D)
// Structural Supply / Ceiling Confluence
isNearLocalS = (high >= szLocal - proxLimit) and (close <= szLocal + proxLimit)
isNear4hS = (high >= sz4h - proxLimit) and (close <= sz4h + proxLimit)
isNearDayS = (high >= szD - proxLimit) and (close <= szD + proxLimit)
isNearWeekS = (high >= szW - proxLimit) and (close <= szW + proxLimit)
isNearPDH = (high >= pdh - proxLimit) and (close <= pdh + proxLimit)
isNearR1 = (high >= r1 - proxLimit) and (close <= r1 + proxLimit)
isNearR2 = (high >= r2 - proxLimit) and (close <= r2 + proxLimit)
isNearR3 = (high >= r3 - proxLimit) and (close <= r3 + proxLimit)
isNearVwapSD2_S = (high >= (vwapD + sdVal * 1.5) - proxLimit) and (close <= (vwapD + sdVal * 2.5) + proxLimit)
isNearSupply = nz(isNearLocalS) or nz(isNear4hS) or nz(isNearDayS) or nz(isNearWeekS) or nz(isNearPDH) or nz(isNearR1) or nz(isNearR2) or nz(isNearR3) or nz(isNearVwapSD2_S)
// ===============================
// GTI ENGINE (CORE REGIME)
// ===============================
trendEma = talib.ema(close, 100)
isBullRegime = close > trendEma
isBearRegime = close < trendEma
isBlueActivity = (close > open) and (volume > volSma * volThreshold) and oiProminent
isRedActivity = (close < open) and (volume > volSma * volThreshold) and oiProminent
plotshape(isBlueActivity and not filterNoise, "Activity ▲", shape.circle, location.belowbar, color.aqua, size=sigSize)
plotshape(isRedActivity and not filterNoise, "Activity ▼", shape.circle, location.abovebar, color.fuchsia, size=sigSize)
// =============================================================================
// REFINED HIGH-RELIABILITY ABSORPTION ENGINE
// =============================================================================
candleRange = math.max(high - low, 0.0001)
bodySize = math.abs(close - open)
bodyRatio = bodySize / candleRange
isAbsBody = bodyRatio <= dojiThreshold
lowerWick = math.min(open, close) - low
upperWick = high - math.max(open, close)
bullAbsWick = lowerWick > candleRange * 0.4 and close > low + candleRange * 0.3
bearAbsWick = upperWick > candleRange * 0.4 and close < high - candleRange * 0.3
volConfirm = volume > volSma * volThreshold
// Limit Order Imbalance Confirmations (Invariant: Identical calculation on Nifty and Bank Nifty)
limitBuyAbsorbing = (limitBuyVol > limitSellVol * absRatioThresh) or bullAbsWick
limitSellAbsorbing = (limitSellVol > limitBuyVol * absRatioThresh) or bearAbsWick
// 1. Raw Absorption Physics:
// Bullish Absorption: Market delta is negative, but Limit Bids absorb selling & price holds/closes green
rawBullAbs = volConfirm and (delta < 0) and limitBuyAbsorbing and (close >= open or bullAbsWick) and (close >= low + candleRange * 0.4)
// Bearish Absorption: Market delta is positive, BUT price FAILS (Closes RED or severe upper rejection wick >= 40%)
rawBearAbs = volConfirm and (delta > 0) and limitSellAbsorbing and (close < open or bearAbsWick) and (close <= high - candleRange * 0.4)
// 2. High-Reliability Structural Confluence Filter:
// ABS (Bullish) is highest reliability at Floor S&R (S1/S2/S3/Demand/PDL)
isHighReliabilityBullAbs = rawBullAbs and isNearDemand
// ABS PRO (Bearish) is ONLY reliable at Ceiling S&R (R1/R2/Supply/PDH). In mid-trend drift, it is NOISE!
isHighReliabilityBearAbs = rawBearAbs and isNearSupply
// 3. Anti-Clutter Cooldown (No consecutive 3-4 arrows in a row):
isBullCooldown = antiRepeatCooldown ? (not rawBullAbs[1] and not rawBullAbs[2]) : true
isBearCooldown = antiRepeatCooldown ? (not rawBearAbs[1] and not rawBearAbs[2]) : true
// Final Decision Logic based on User Clean-Chart Controls:
// Keep HIGH-RELIABILITY signals; HIDE less reliable mid-trend drift noise
finalBullAbs = showAbsBull and (showReliableOnly ? (isHighReliabilityBullAbs and isBullCooldown) : (rawBullAbs and isBullCooldown))
finalBearAbs = showAbsBear and (showReliableOnly ? (isHighReliabilityBearAbs and isBearCooldown) : (hideMidTrendAbs ? (rawBearAbs and isNearSupply and isBearCooldown) : (rawBearAbs and isBearCooldown)))
// =============================================================================
// CLEAN PLOTTING (PROMINENT SIGNALS, ZERO CLUTTER)
// =============================================================================
// Bullish Absorption: Plotted cleanly at structural bottoms (e.g. 54,370 S3 Reversal)
plotshape(finalBullAbs and showLabels, "ABS (Bullish Absorption) Label ▲", shape.triangleup, location.belowbar, color.lime, text="ABS", size=sigSize)
plotshape(finalBullAbs and not showLabels, "ABS (Bullish Absorption) Shape ▲", shape.triangleup, location.belowbar, color.lime, text="", size=sigSize)
// Bearish Absorption: Plotted strictly at structural ceilings (R1/R2/Day High), hidden during mid-trend drift
plotshape(finalBearAbs and showLabels, "ABS PRO (Bearish Absorption) Label ▼", shape.triangledown, location.abovebar, color.red, text="ABS PRO", size=sigSize)
plotshape(finalBearAbs and not showLabels, "ABS PRO (Bearish Absorption) Shape ▼", shape.triangledown, location.abovebar, color.red, text="", size=sigSize)
// =============================================================================
// POWER TRADE (P+ / P-) LOGIC (FILTERED AGAINST LIMIT TRAPS)
// =============================================================================
actualIntensity = (math.abs(delta) / math.max(volume, 1)) * (volume / math.max(volSma, 1))
actualIntensitySma = talib.sma(actualIntensity, 20)
instFilling = (volume > volSma * 1.5) and (actualIntensity > actualIntensitySma * absOiMult)
isAbsDojiBody = strictPTrade ? isAbsBody : true
// P+ Trigger: Must have positive delta, price must NOT be trapped by Limit Sells, and candle closes strong
strongBullDoji = showPowerTrades and isAbsDojiBody and instFilling and (delta > 0) and (not rawBearAbs) and (close >= (open + candleRange * 0.1))
// P- Trigger: Must have negative delta, price must NOT be trapped by Limit Bids, and candle closes weak
strongBearDoji = showPowerTrades and isAbsDojiBody and instFilling and (delta < 0) and (not rawBullAbs) and (close <= (open - candleRange * 0.1))
plotshape(strongBullDoji and showLabels, "Power Trade Buy Label (P+)", shape.triangleup, location.belowbar, #0066FF, text="P+", size=size.small)
plotshape(strongBullDoji and not showLabels, "Power Trade Buy Shape (P+)", shape.triangleup, location.belowbar, #0066FF, text="", size=size.small)
plotshape(strongBearDoji and showLabels, "Power Trade Sell Label (P-)", shape.triangledown, location.abovebar, #AA00FF, text="P-", size=size.small)
plotshape(strongBearDoji and not showLabels, "Power Trade Sell Shape (P-)", shape.triangledown, location.abovebar, #AA00FF, text="", size=size.small)
// ===============================
// LVT & ST RETEST CONFIRMATIONS
// ===============================
isLVT_Direct = (volume < volSma * trapVolThreshold) and (volume < volume[1]) and (close >= open)
isLVT_Lagged = (volume[1] < volSma[1] * trapVolThreshold) and (volume[1] < volume[2]) and (close >= open) and (close[1] < open[1])
isLVT = isLVT_Direct or isLVT_Lagged
isST_Direct = (volume < volSma * trapVolThreshold) and (volume < volume[1]) and (close <= open)
isST_Lagged = (volume[1] < volSma[1] * trapVolThreshold) and (volume[1] < volume[2]) and (close <= open) and (close[1] > open[1])
isST = isST_Direct or isST_Lagged
showLVT = showLVTST and isLVT and isNearDemand and (not filterNoise or not isLVT[1])
showST = showLVTST and isST and isNearSupply and (not filterNoise or not isST[1])
plotshape(showLVT and showLabels, "LVT Label ▲", shape.triangleup, location.belowbar, color.lime, text="L▲", size=sigSize)
plotshape(showLVT and not showLabels, "LVT Shape ▲", shape.triangleup, location.belowbar, color.lime, text="", size=sigSize)
plotshape(showST and showLabels, "ST Label ▼", shape.triangledown, location.abovebar, color.orange, text="S▼", size=sigSize)
plotshape(showST and not showLabels, "ST Shape ▼", shape.triangledown, location.abovebar, color.orange, text="", size=sigSize)
// =============================================================================
// ALERTS ENGINE
// =============================================================================
if enableAlerts and barstate.islast {
if finalBullAbs {
alert("GTI_LIPI: High-Reliability ABS Bullish Floor Reversal (Limit Bids Defending S2/S3)")
}
if finalBearAbs {
alert("GTI_LIPI: High-Reliability ABS PRO Bearish Ceiling Reversal (Limit Asks Capping Highs)")
}
if strongBullDoji {
alert("GTI_LIPI: Power Trade Buy (P+) Institutional Breakthrough")
}
if strongBearDoji {
alert("GTI_LIPI: Power Trade Sell (P-) Institutional Breakdown")
}
}
alertcondition(finalBullAbs, title="ABS Bull Floor Reversal", message="ABS Bullish Absorption (Floor Support)")
alertcondition(finalBearAbs, title="ABS PRO Bear Ceiling Reversal", message="ABS PRO Bearish Absorption (Ceiling Resistance)")
alertcondition(strongBullDoji, title="P+ Power Buy", message="P+ Power Buy Breakthrough")
alertcondition(strongBearDoji, title="P- Power Sell", message="P- Power Sell Breakdown")
The information and publications are not meant to be, and do not constitute, financial, investment, trading, or other types of advice or recommendations supplied or endorsed by GoCharting. Read more in the Terms of Use.
Comments (0)
Loading comments…