Community Trading Scripts & Custom Indicators
Browse Lipi Scripts · Trading Strategies · Custom Indicators
24 Scripts Downloaded…
order flow
order flow analysys of the backtest dataKUZGSHJGSJhbsjkHJKsxdkjSGXKASCKASGCSHJCGSHJCGHJSCGJHSGCHJACGHJACHASGCHASGHASGXAHSFCXHASFCXCGHASFCGHASVCGHASNVXHGVXHZVHVxHVhHJz

 Protected
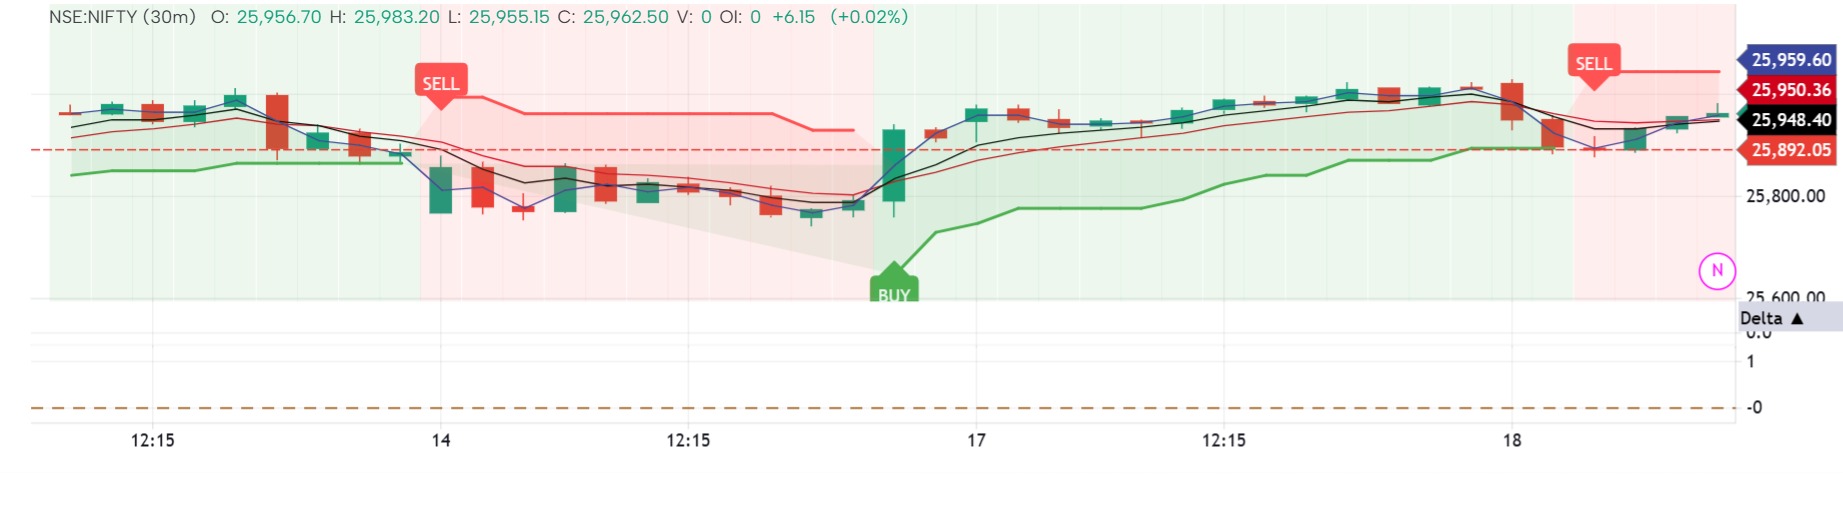
OF Part A: Institutional + Unwind + Absorption
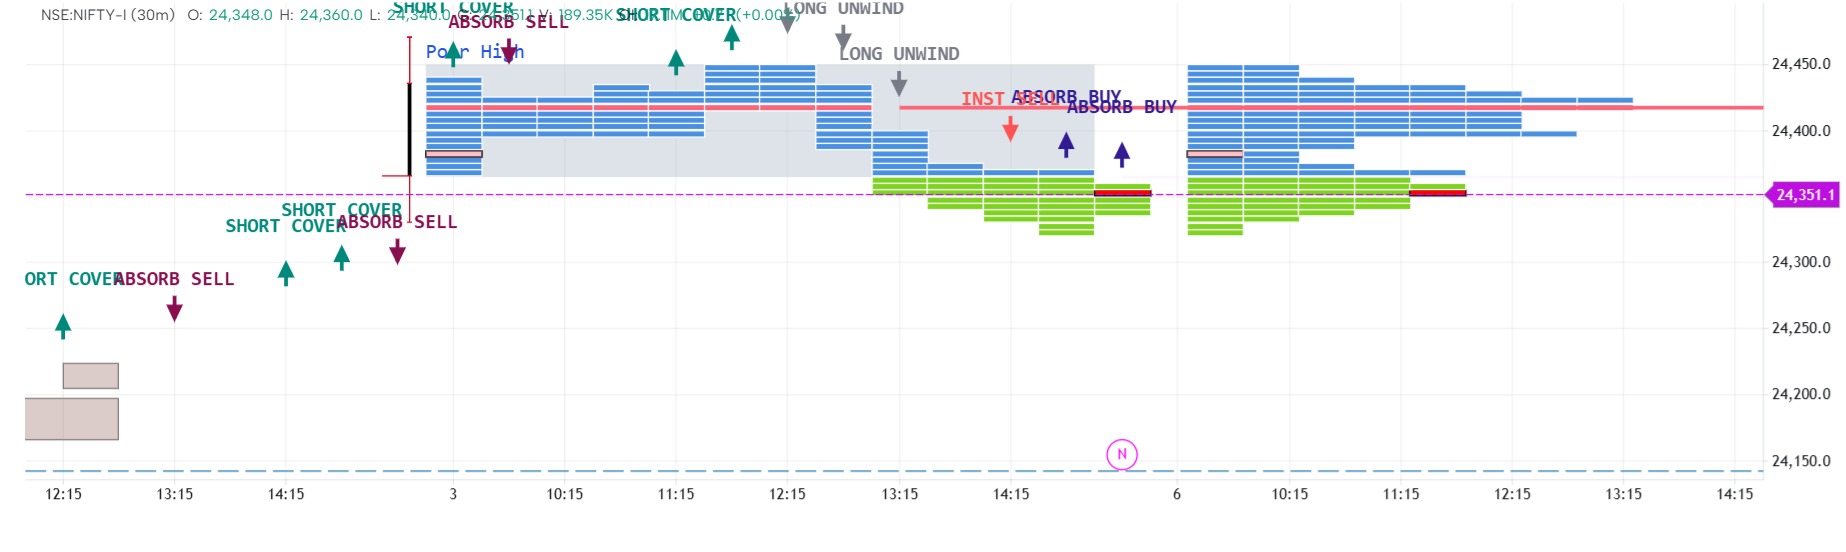
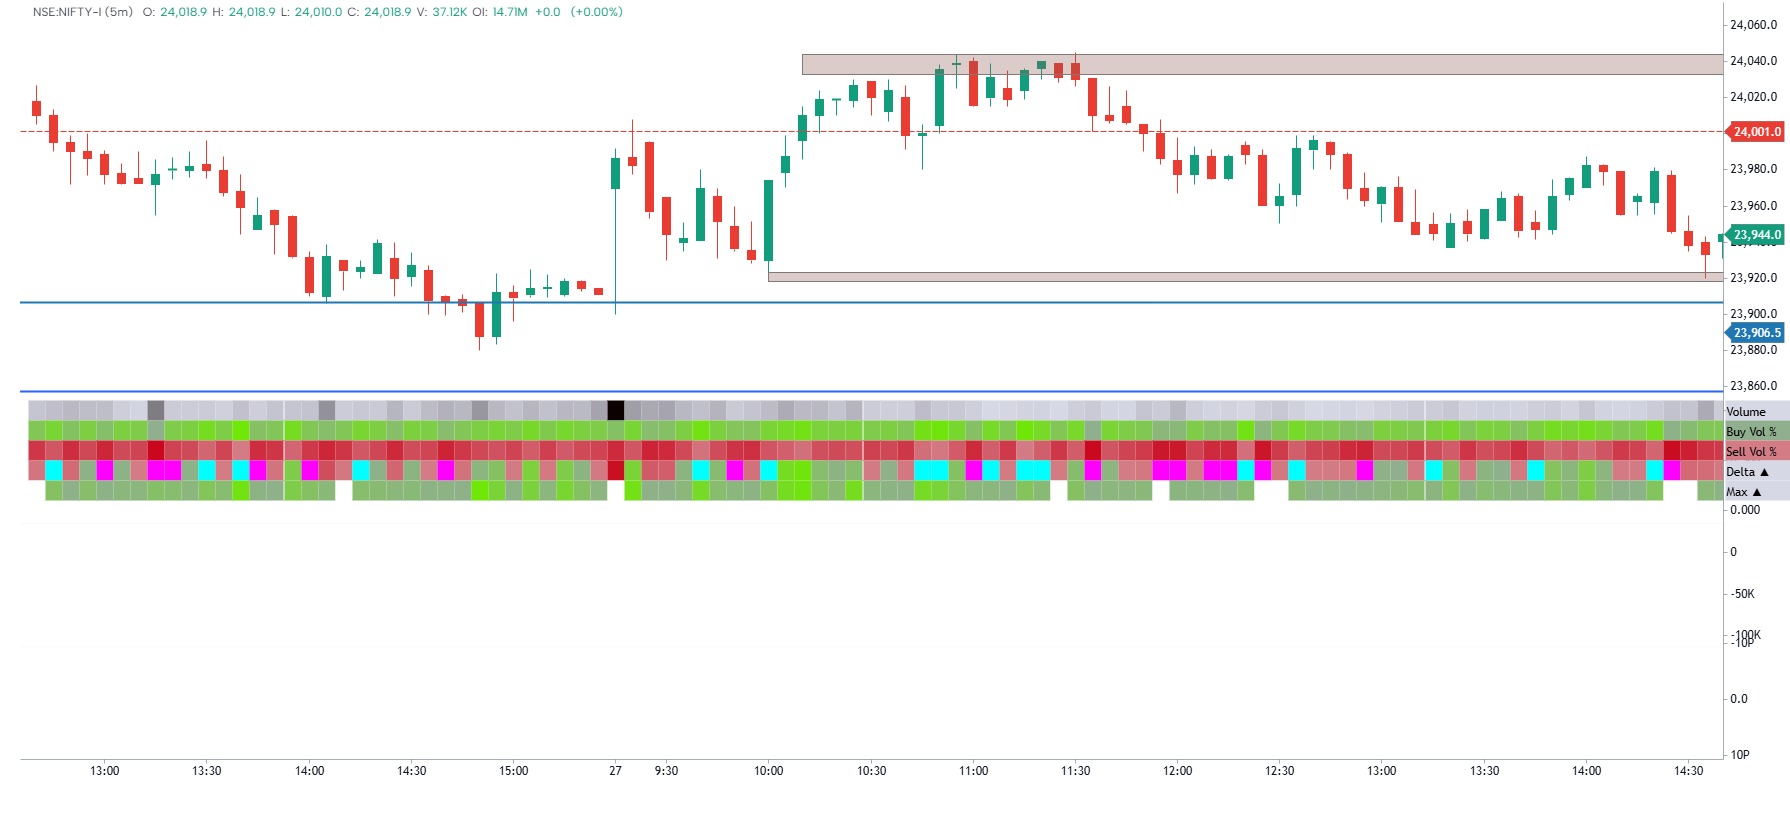
identifies 6 high-probability institutional order flow setups in real time using Delta, Open Interest, and Volume Imbalance. Designed for Footprint/Cluster charts on any index or futures instrument. ## What This Indicator Does This indicator reads raw order flow data — Delta, Buy/Sell Volume, and Open Interest — to classify institutional activity into 6 clearly labelled signals directly on your candles. No lagging moving averages. No price-derived indicators. Pure order flow logic. It is Part A of a two-part institutional flow suite. Part B covers Exhaustion, Delta Divergence, and Delta Flips. ## The 6 Signals ### 🟢 INST BUY — Institutional Buying **Color: Green arrow below bar** Strong positive delta (aggressive buying) + price closes up + Open Interest is rising. Rising OI confirms fresh long positions are entering — this is not short covering or noise, it is new institutional money going long. **Best use:** Look for this at key support levels, VWAP reclaims, or after a consolidation. When OI rises with positive delta and a green close, smart money is accumulating. ### 🔴 INST SELL — Institutional Selling **Color: Red arrow above bar** Strong negative delta (aggressive selling) + price closes down + Open Interest is rising. Rising OI with negative delta confirms fresh short positions entering — institutions are initiating short positions, not just exiting longs. **Best use:** Look for this at resistance zones, failed breakouts, or distribution areas. The combination of OI rising and negative delta is one of the most reliable bearish footprints. ### 🩵 SHORT COVER — Short Covering **Color: Teal arrow below bar** Price closes up + positive delta + Open Interest is falling. OI falling means existing positions are being closed. Combined with positive delta and an up close, this signals shorts buying back to exit — not new longs entering. **Best use:** Short covering often creates sharp but unsustainable rallies. Use it as a warning that an up move may be a relief rally rather than genuine bullish momentum. Do not chase these moves blindly. ### ⚫ LONG UNWIND — Long Unwinding **Color: Gray arrow above bar** Price closes down + negative delta + Open Interest is falling. OI falling with selling pressure means longs are exiting their positions — not new shorts entering. This often happens at the end of a trend. **Best use:** Long unwinding near highs or after an extended rally is an early warning of trend exhaustion. When longs exit and OI drops, the fuel driving the rally is being removed. ### 🔵 ABSORB BUY — Bull Absorption **Color: Navy blue arrow below bar** Sell volume dominates (bearish imbalance) but price still closes up or flat, with a visible rejection wick. Sellers are aggressively attacking but passive buyers at limit orders are absorbing every sell — price cannot fall. **Logic:** SellVolume > BuyVolume × 1.3 AND close ≥ open AND bar has a significant wick (body **Best use:** Look for this at support levels or value areas. When sellers dominate volume but price refuses to drop, it signals a strong buyer defending a level. This is the core concept from Trader Dale's absorption methodology. ### 🟤 ABSORB SELL — Bear Absorption **Color: Maroon arrow above bar** Buy volume dominates (bullish imbalance) but price still closes down or flat, with a visible rejection wick. Buyers are aggressively attacking but passive sellers at limit orders are absorbing every buy — price cannot rise. **Logic:** BuyVolume > SellVolume × 1.3 AND close ≤ open AND bar has a significant wick. *Best use:** Look for this at resistance levels, prior highs, or supply zones. When buyers dominate volume but price refuses to rise, it signals a strong seller defending a level. High-probability reversal signal. ## Inputs / Settings | Parameter | Default | Description | |---|---|---| | Delta Threshold | 40,000 | Minimum delta for INST BUY/SELL signals. Adjust based on instrument — Nifty Futures 30m typically sees deltas of 50K–300K. Lower to 5,000–10,000 for 5m charts or lower-volume instruments. | | Bid/Ask Imbalance Ratio | 1.3 | Minimum ratio of sell-to-buy (or buy-to-sell) volume for Absorption signals. 1.3 = 30% more aggressive volume on one side. Raise to 1.5–2.0 to filter only extreme imbalances. | | OI Lookback bars | 1 | How many bars back to compare OI for rising/falling detection. Default 1 = previous bar. Increase to 3–5 for smoother OI trend detection on noisy data. | ## How to Use **Chart Type:** Footprint / Cluster chart (required for delta and volume split data) **Recommended Timeframes:** 5m, 15m, 30m on Nifty Futures, Bank Nifty, Crude Oil, or any high-liquidity futures instrument **Alert Setup:** 1. Apply the indicator to your chart 2. Click **Alert** → select **"OF Part A: Institutional + Unwind + Absorption"** 3. Set condition to **"Any alert() function call"** 4. Choose notification method (Push / Email / Webhook) 5. One alert catches all 6 signal types with full details in the alert message ## Signal Hierarchy for Trading Use these signals in context, not in isolation: 1. **INST BUY + INST SELL** → Highest conviction. Fresh institutional money with OI confirmation. 2. **ABSORB BUY + ABSORB SELL** → Strong level identification. Best used at known S/R. 3. **SHORT COVER + LONG UNWIND** → Trend exhaustion warning. OI falling means the move has less backing. **Pro tip:** When INST BUY and ABSORB BUY appear within 2–3 bars of each other at the same level, it is a very high-conviction long setup — institutional buying confirmed both by new long entries AND by rejection of sellers at that level. ## Companion Indicator **OF Part B: Exhaustion + Divergence + Flip** — covers Buyer/Seller Exhaustion, Delta Divergence (Lesson 4 methodology), and Delta Flip signals. Apply both together for complete institutional flow coverage across all 12 signal types. *This indicator is for educational and informational purposes. All trading involves risk. Past signals do not guarantee future results.*

 Protected
Based on cvd
only use if stock or option move above 10% to 50% for safe trg combination of multiple ideasonly for trg and exit orfresh breakout buy

 Protected
VALUE AREA
This Indicator is used to mark value area zones inside the chart, which makes it static and displays the price point names at the end of the line

 Protected
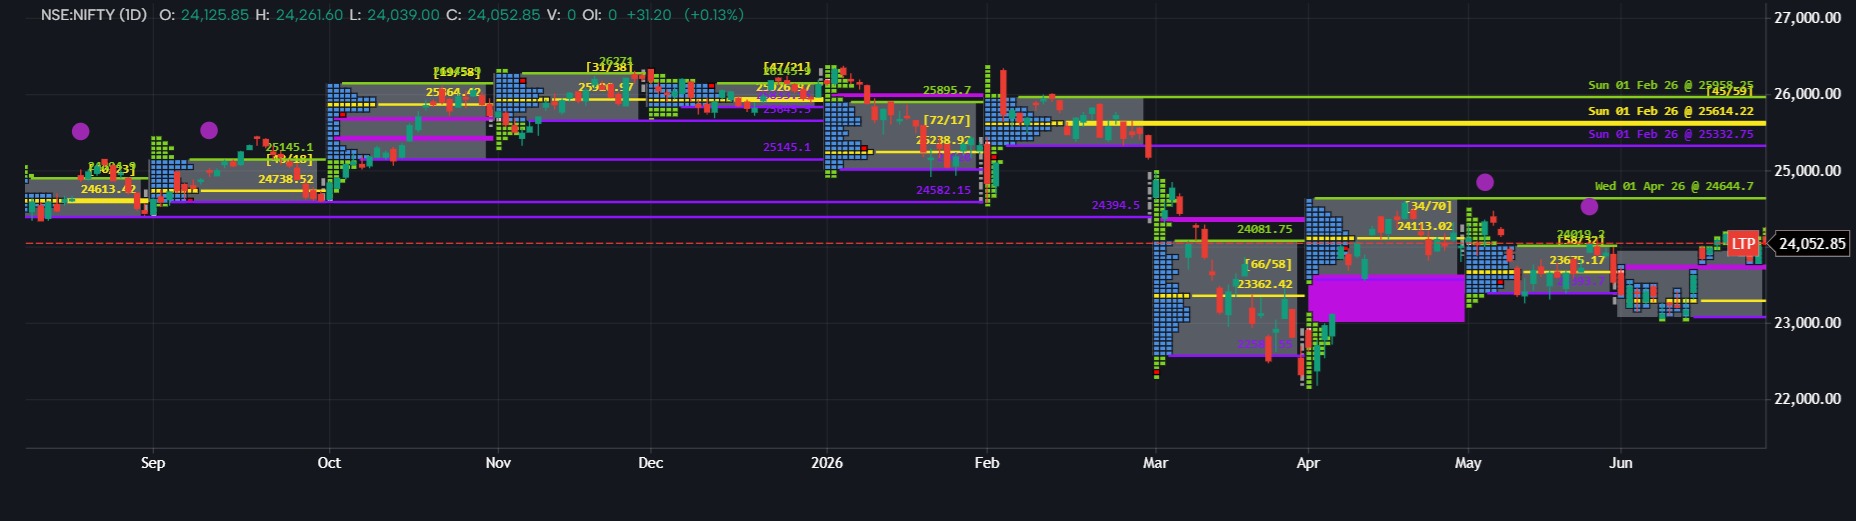
Single print
This indicator maps the Time Price Opportunity (TPO) Market Profile structure to track institutional order flow imbalances in real time. The core objective of this tool is to automatically isolate and highlight structural "Single Prints" within the intraday session. A Single Print occurs when aggressive market participants drive price rapidly through a zone, leaving behind rows containing exactly one TPO block. These areas represent significant liquidity gaps and macro structural inefficiencies where two-way auctioning did not fully take place. By identifying these zones immediately upon a confirmed bar close, traders can pinpoint high-probability support and resistance areas, as price frequently treats unvisited Single Prints like structural magnets in subsequent trading sessions.

Multi-EMA's
This, Indicator carries, multiple EMA, which can be changed in the setting tab as per the requirement of the user. It helps plot, mutiple EMA Altogether,

absorption Bubbles
Shows buying and selling pressure. The green bubble show buyers bieeng absorbed in the market and the red bubbles show sellers bieng absorbed in the market.

 Protected
VOLATILITY
This indicator helps us to find the volatility of the said asset in real time, by comparing it with the past and average volatility. You can adjust the no of candles it uses for calculation
 Protected
Momentum
This public, protected script utilizes specific structural market indicators designed to capture momentum shifts across various asset classes. The algorithm processes real-time volatility inputs to isolate high-probability trend continuations while implementing fixed structural risk boundaries to preserve trading capital.

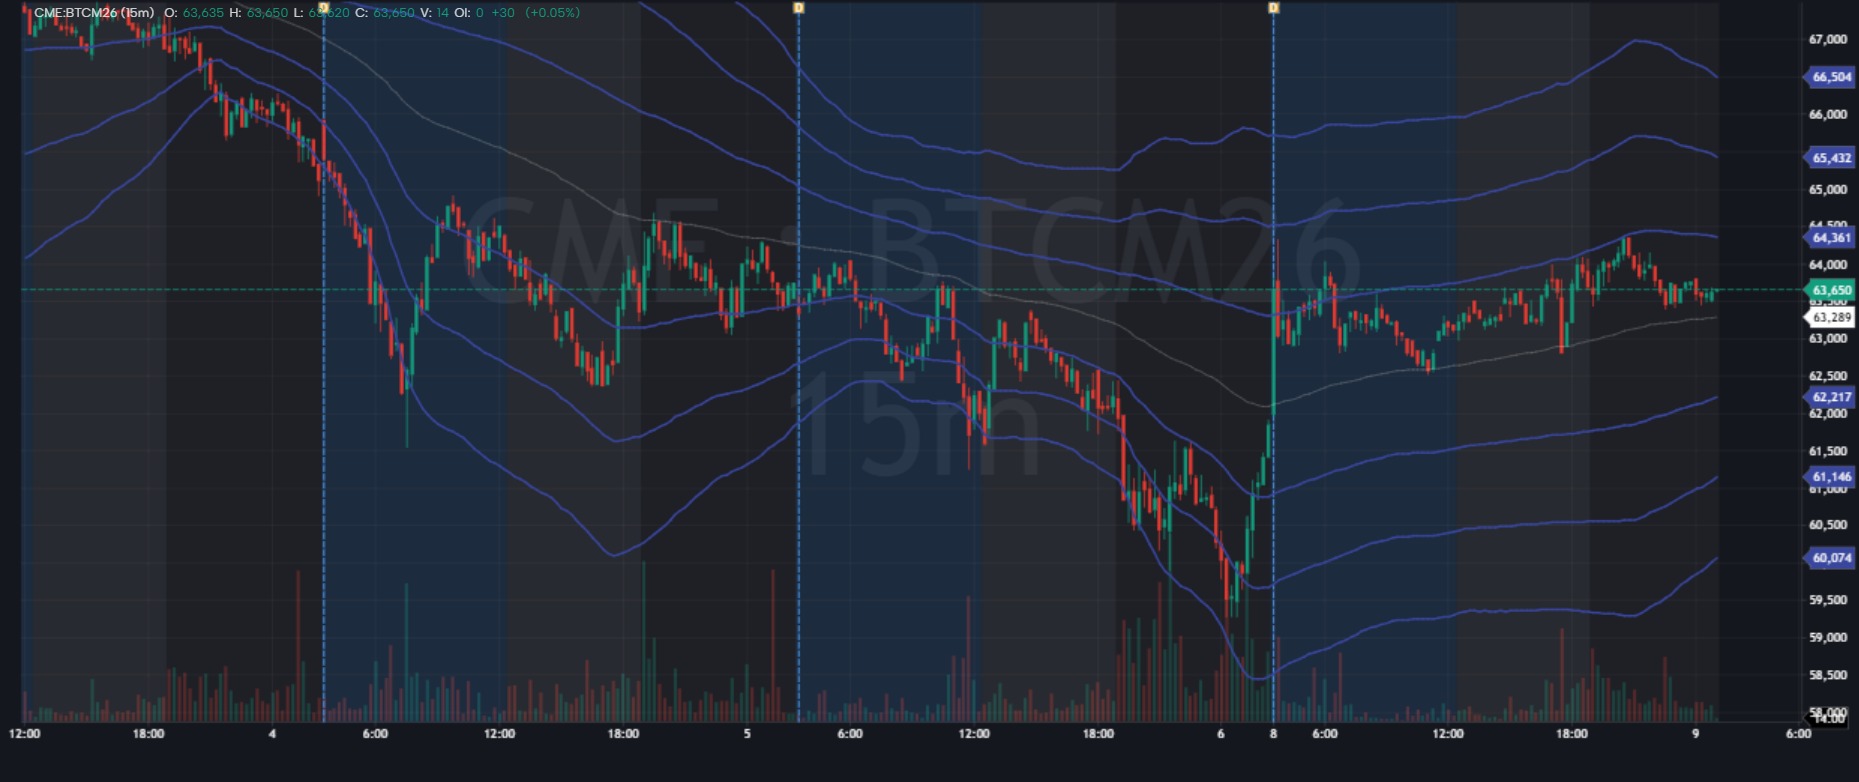
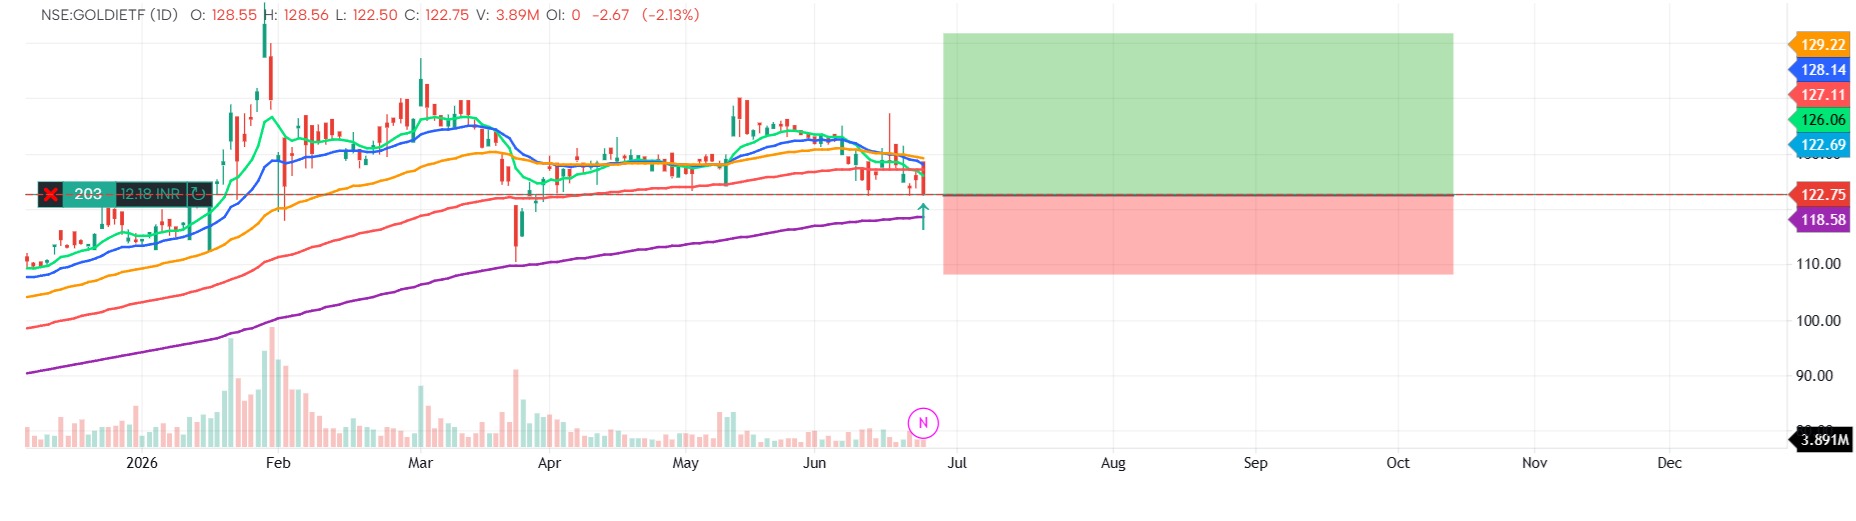
Stretch Bands
• EMA-based statistical mean with dynamic standard deviation bands. • Visualizes price stretch using ±1σ, ±2σ, and ±3σ levels. • Helps identify normal, extended, and extreme market conditions. • Useful for volatility analysis, mean reversion, and trend monitoring. • Adapts to changing market volatility instead of using fixed percentage levels. • Designed for crypto, futures, indices, and other liquid markets. • Not a trading signal generator; intended as a statistical context tool

 Protected
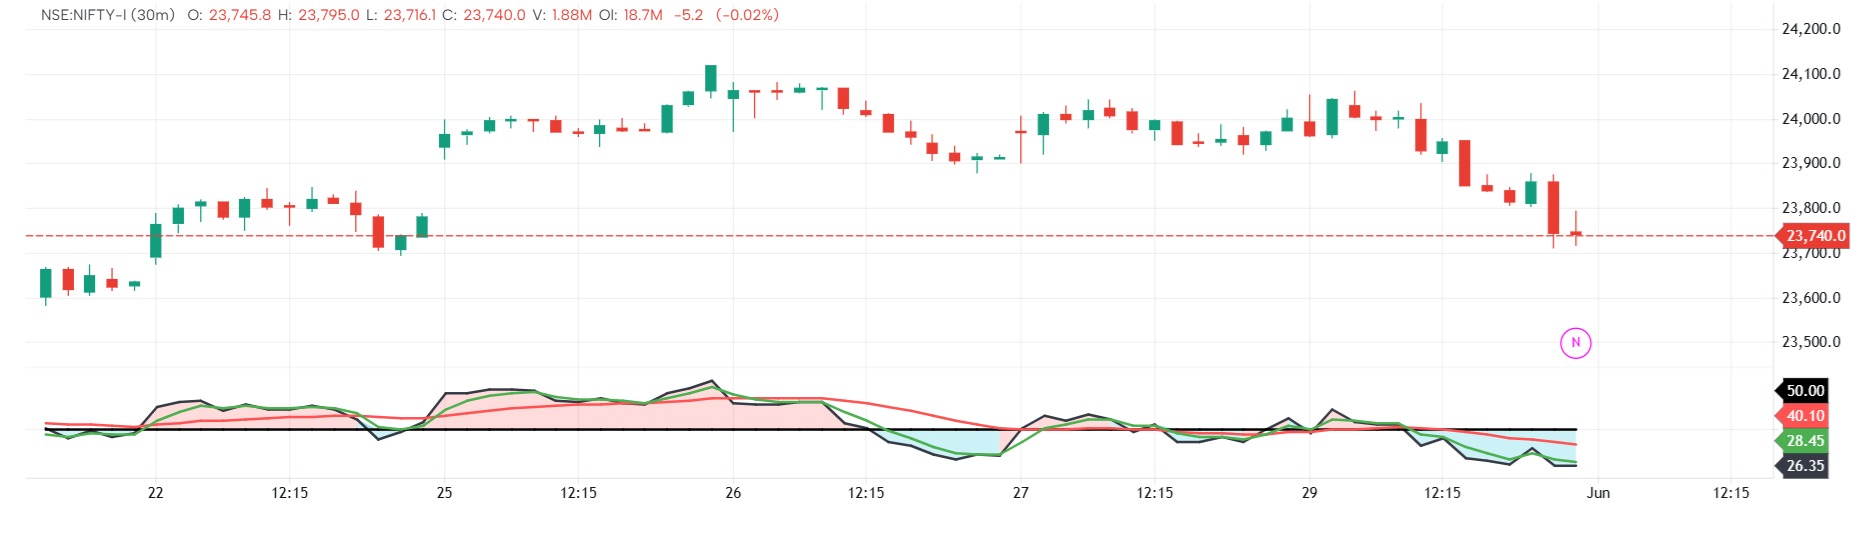
HILEGA-MILEGA (M)
HILEGA MILEGA BY NK SIR USES 9 RSI 3 EMA AND 21 WMA AVAILABLE FOR EVERYONE TO USE

 Protected
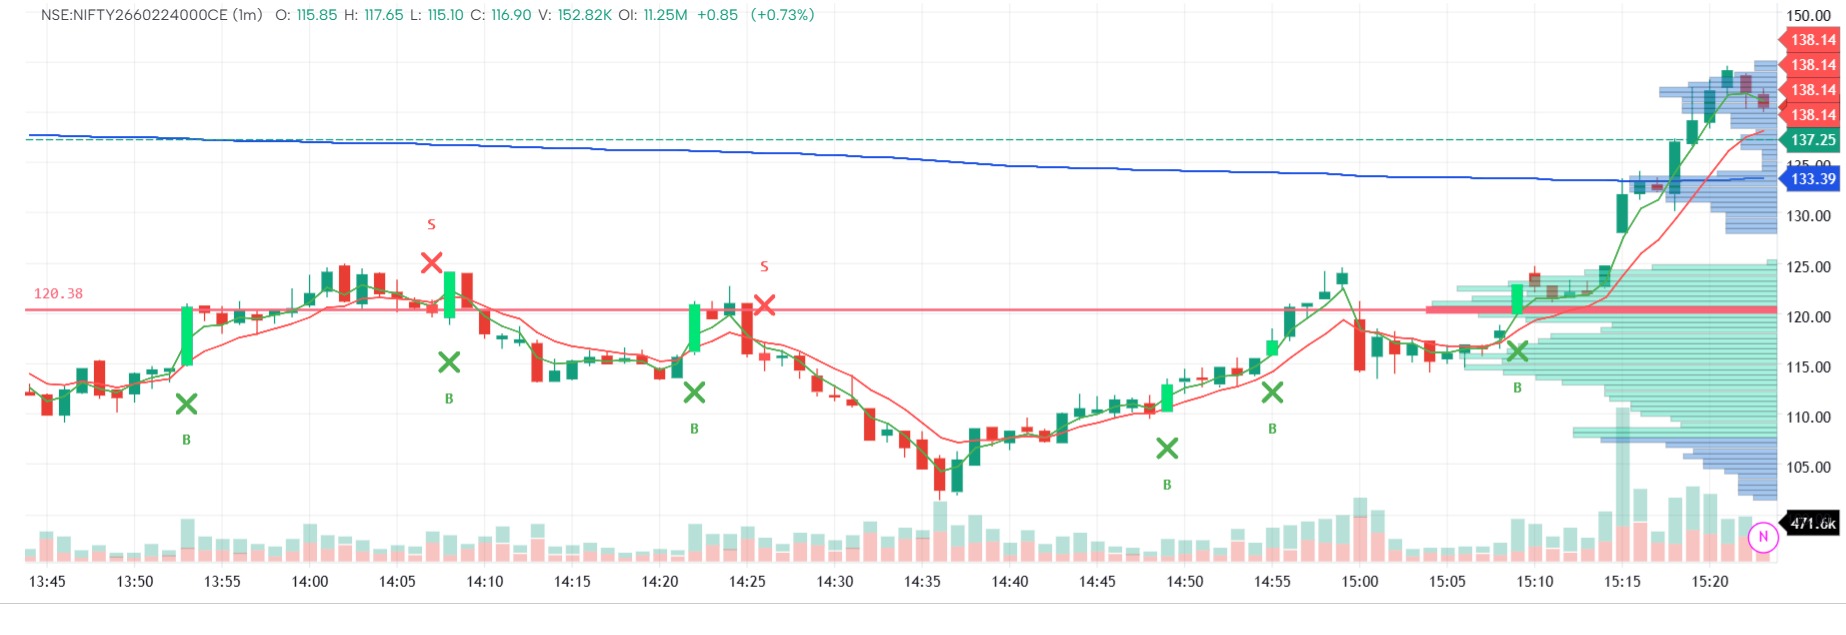
option master 1
buy sell indicator for premium chart perfect signal its a master tool green buy red sell powerul moving average comination driven by orderflow and delta

Chop Zone Histogram Nitin 5M
This script is a custom version of the “Chop Zone” indicator.It measures the angle/slope of the 34 EMA and colors a histogram based on trend strength and direction. The idea is: Strong upward EMA slope → bullish colors Strong downward EMA slope → bearish colors Flat EMA slope → yellow (choppy/ranging market)

 Protected
Delta Flow && Resistance
Delta Flow Delta Flow indicator describes the impact of the aggressive orders on the market price through Delta value.

Delta Flow + Delta Resistance
Delta Flow Delta Flow indicator describes the impact of the aggressive orders on the market price through Delta value. Delta Rotation Delta rotation describes the demand and supply per market rotation through Delta. Delta rotation describes the demand and supply per market rotation through Delta. This allows us to assess whether or not each price movement can be assigned with an increase of demand/supply or on the opposite on the diminishing supply and demand. The following examples cover different entry points from reference points based on supply and demand shifts

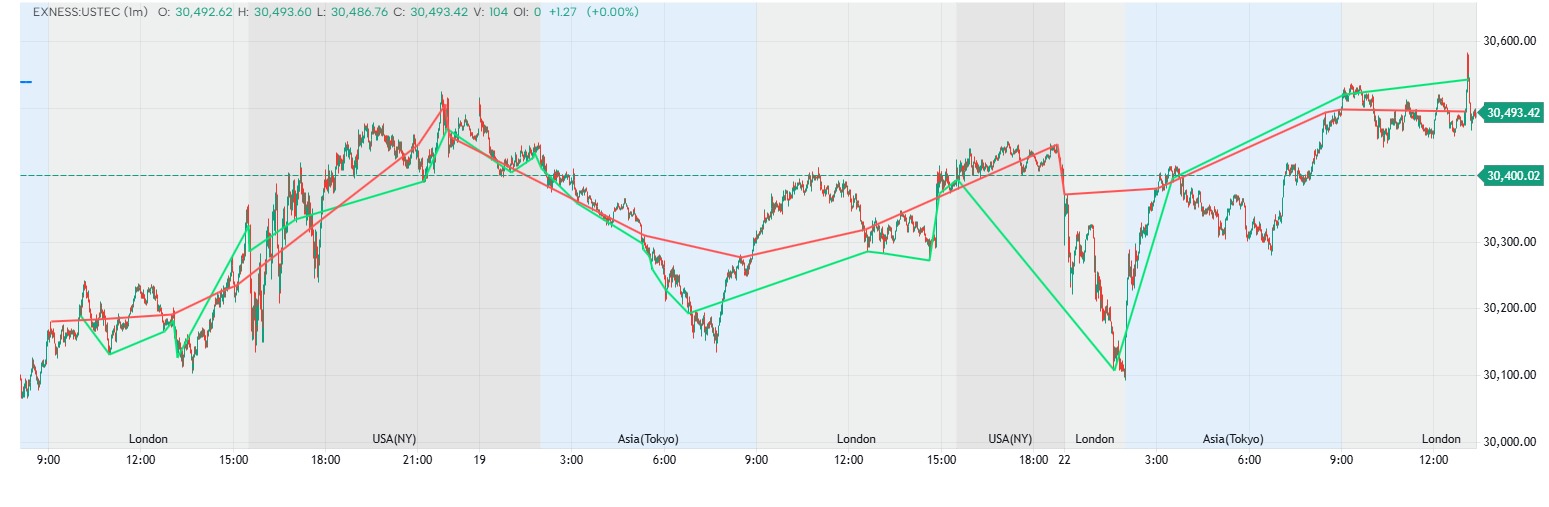
1BullBear™ - Sessions
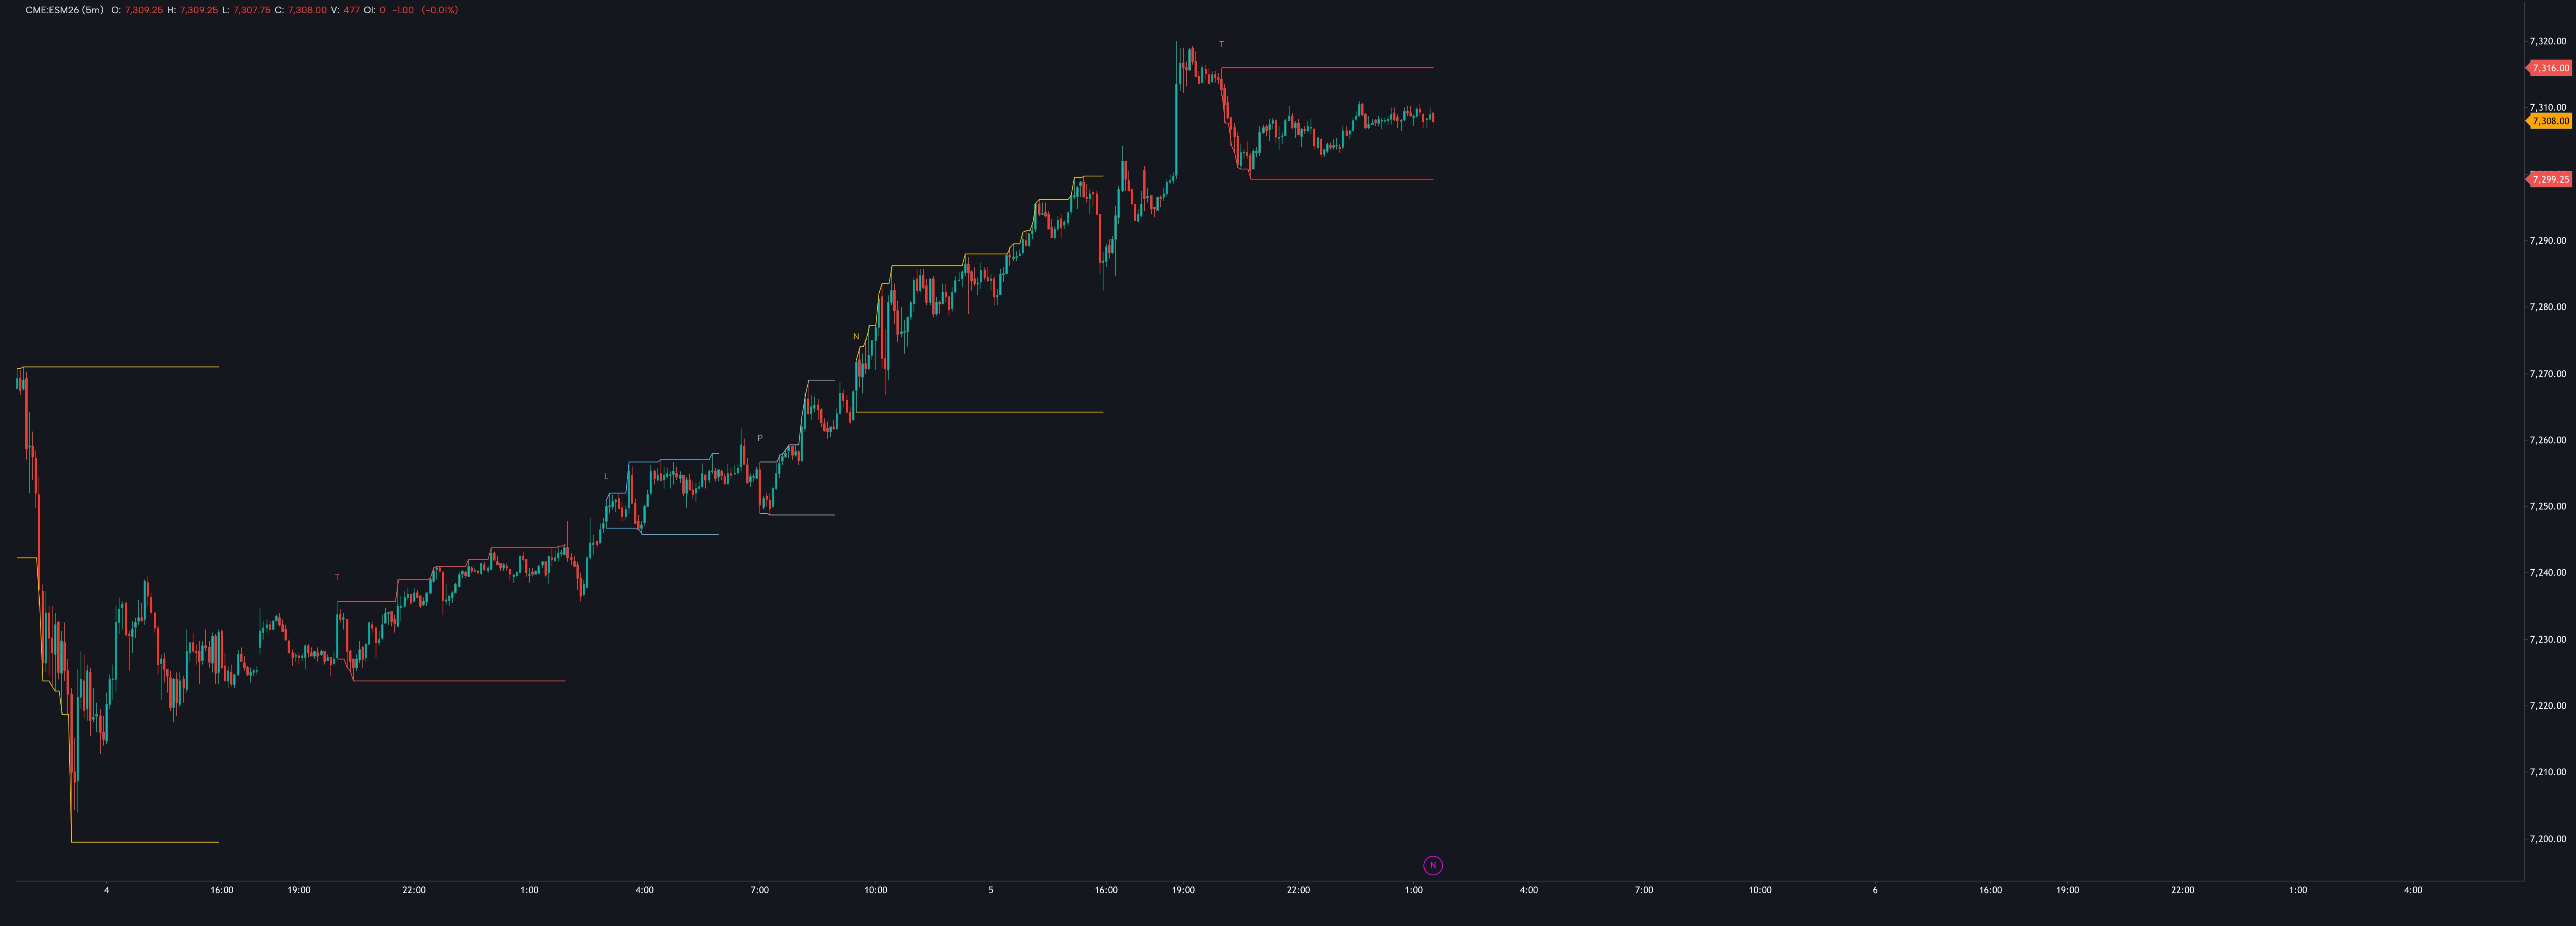
1BB Sessions — Multi-session high/low tracker for the four major global trading windows, with automatic DST handling. What it shows For each of Tokyo, London, Premarket (US), and New York, the indicator draws: A top line tracking the running session high A bottom line tracking the running session low A single-character open marker above the first bar (T / L / P / N) Each session is evaluated in its own local time, and DST is handled automatically — US sessions follow EDT/EST (2nd Sunday March → 1st Sunday November), London follows BST/GMT (last Sunday March → last Sunday October), Tokyo is fixed JST year-round. Default windows (city local time) Tokyo 09:00 – 15:00 London 08:00 – 11:00 Premarket 07:00 – 09:00 New York 09:30 – 16:00 Inputs Show / hide each session independently Pick a custom color per session Notes (V1) First port of the Sessions module from the Pine Script v6 indicator "1BullBear" by KweeBoss_ (TradingView, MPL 2.0). LipiScript doesn't currently expose drawing primitives (no box.new, line.new, or label.new), so the original Pine boxes are approximated using paired plots for the top/bottom and per-bar character markers for the opens. If LipiScript adds those primitives — or relaxes some of the parser constraints around float math and typing inside functions — a V2 with editable times, background fills, and proper labels becomes straightforward. Credit: Original Pine Script "1BullBear" by KweeBoss_ — TradingView, MPL 2.0.

 Protected
Dual Rolling VWAP
El Rolling VWAP (VWAP rodante) es una evolución del VWAP tradicional diseñada para eliminar el "efecto memoria" o el sesgo del punto de inicio. Para entenderlo, primero debemos recordar que el VWAP estándar siempre empieza a calcularse desde un evento fijo (normalmente la apertura de la sesión, el inicio del mes o del año). El Rolling VWAP, en cambio, utiliza una ventana móvil de tiempo o de velas.

 Protected
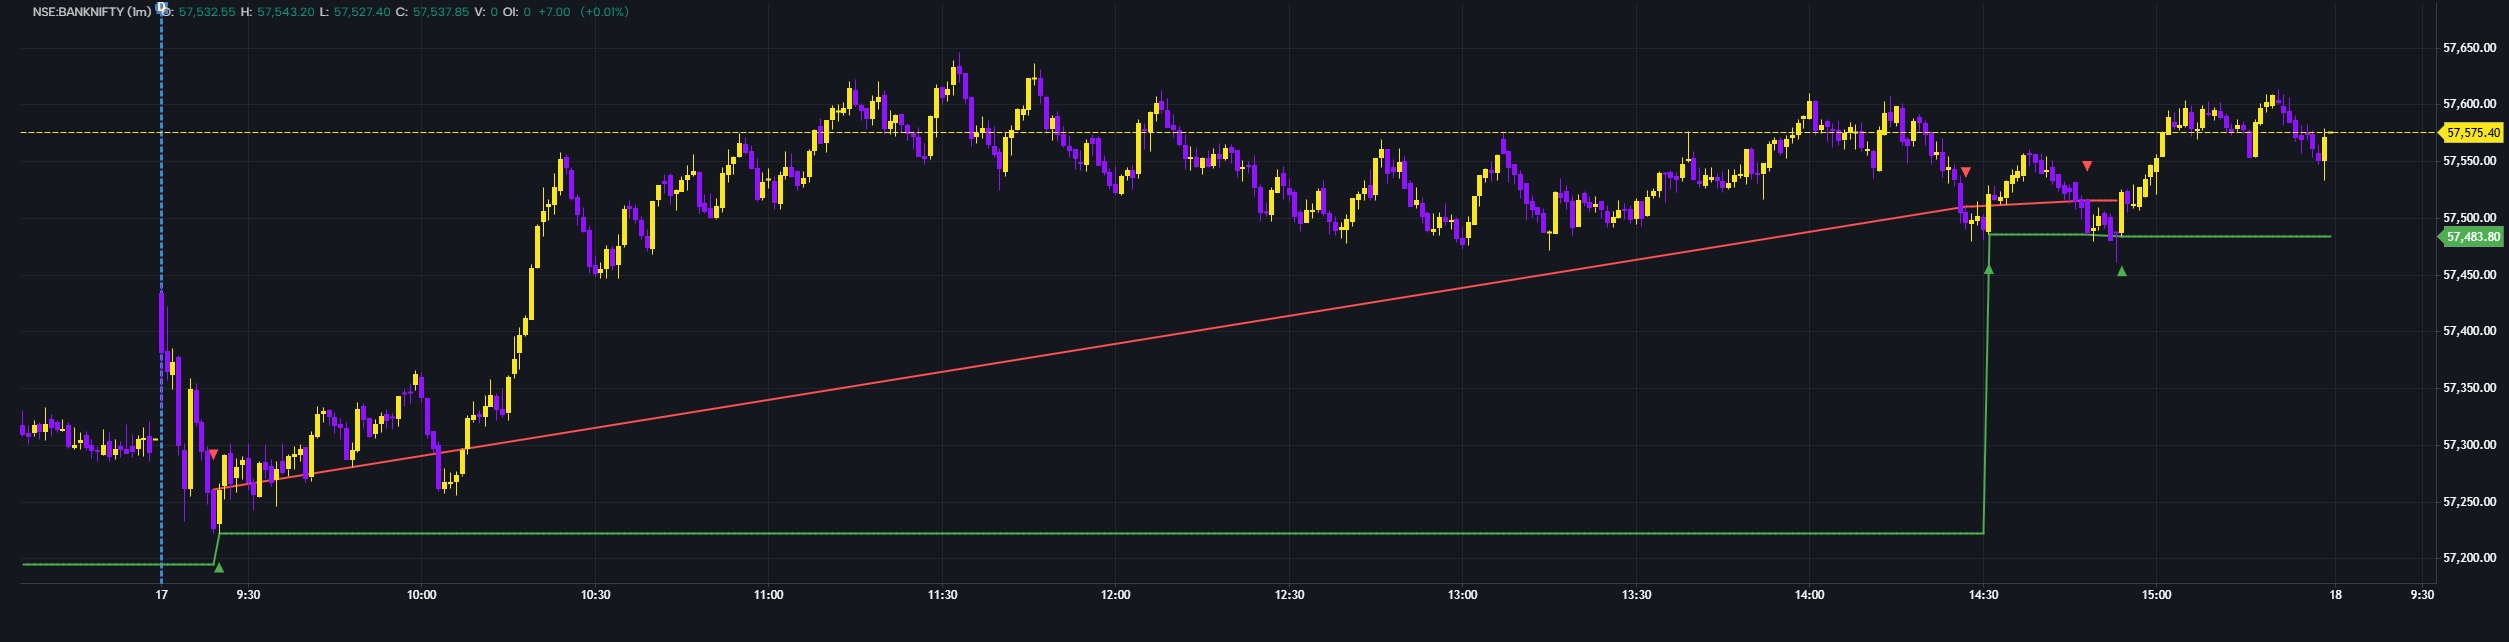
RDC
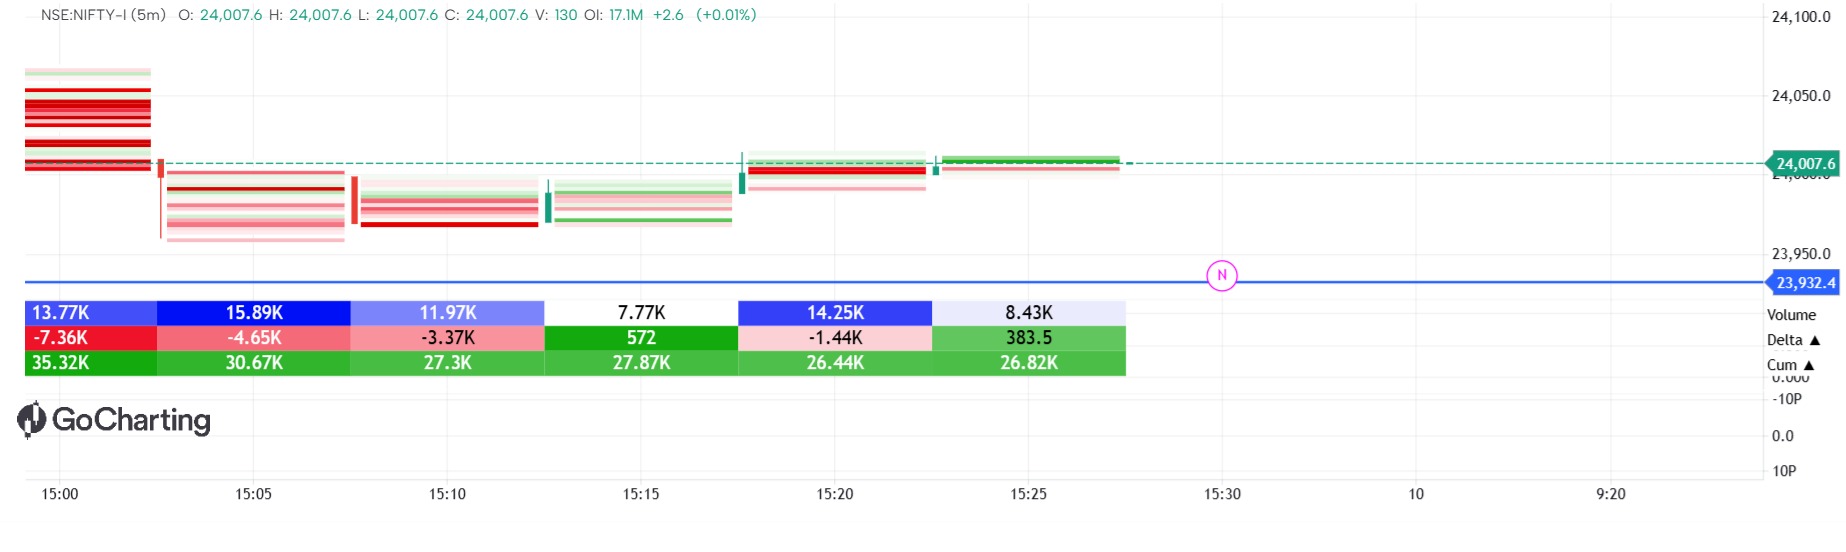
On a 30 minute time frame, when a green candle has negative Min / max delta threshold, and the high of that candle Is broken by the next candle, then we get a buy alert. We star trailing SL at 5% while keeping the SL at 3%. Vice Versa for a red candle .

Delta Divergence with Delta Threshold
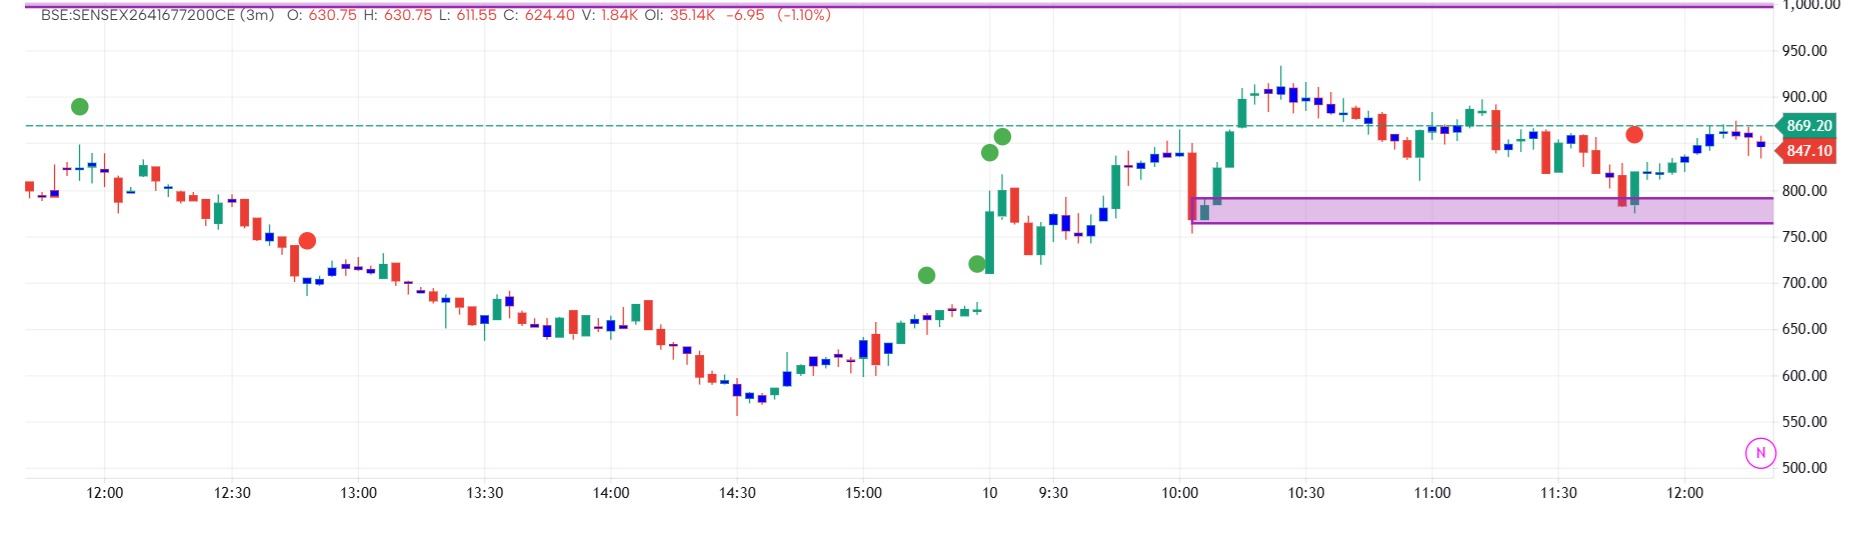
This indicator is designed to identify delta divergence-based reversal opportunities using order flow data. For a buy setup, it first detects a divergence where the price shows strength (a green candle), but the underlying order flow is weak (negative delta). This suggests hidden selling pressure despite price moving up. The next candle must confirm strength by being bullish (green) with a strong delta (at least 90% of the maximum or minimum delta), indicating aggressive buying entering the market. When this confirmation occurs, an up arrow is plotted on the divergence candle, signaling a potential upward move. For a sell setup, the logic is reversed. It identifies a red candle (price weakness) with positive delta, indicating hidden buying pressure. The following candle must be bearish (red) with a strong imbalance in delta, confirming aggressive selling. A down arrow is then plotted on the divergence candle, signaling a potential downward move. Overall, the strategy combines price action and order flow imbalance to detect situations where the market may reverse after absorbing opposing pressure, making it useful for spotting high-probability trade entries.

 Protected
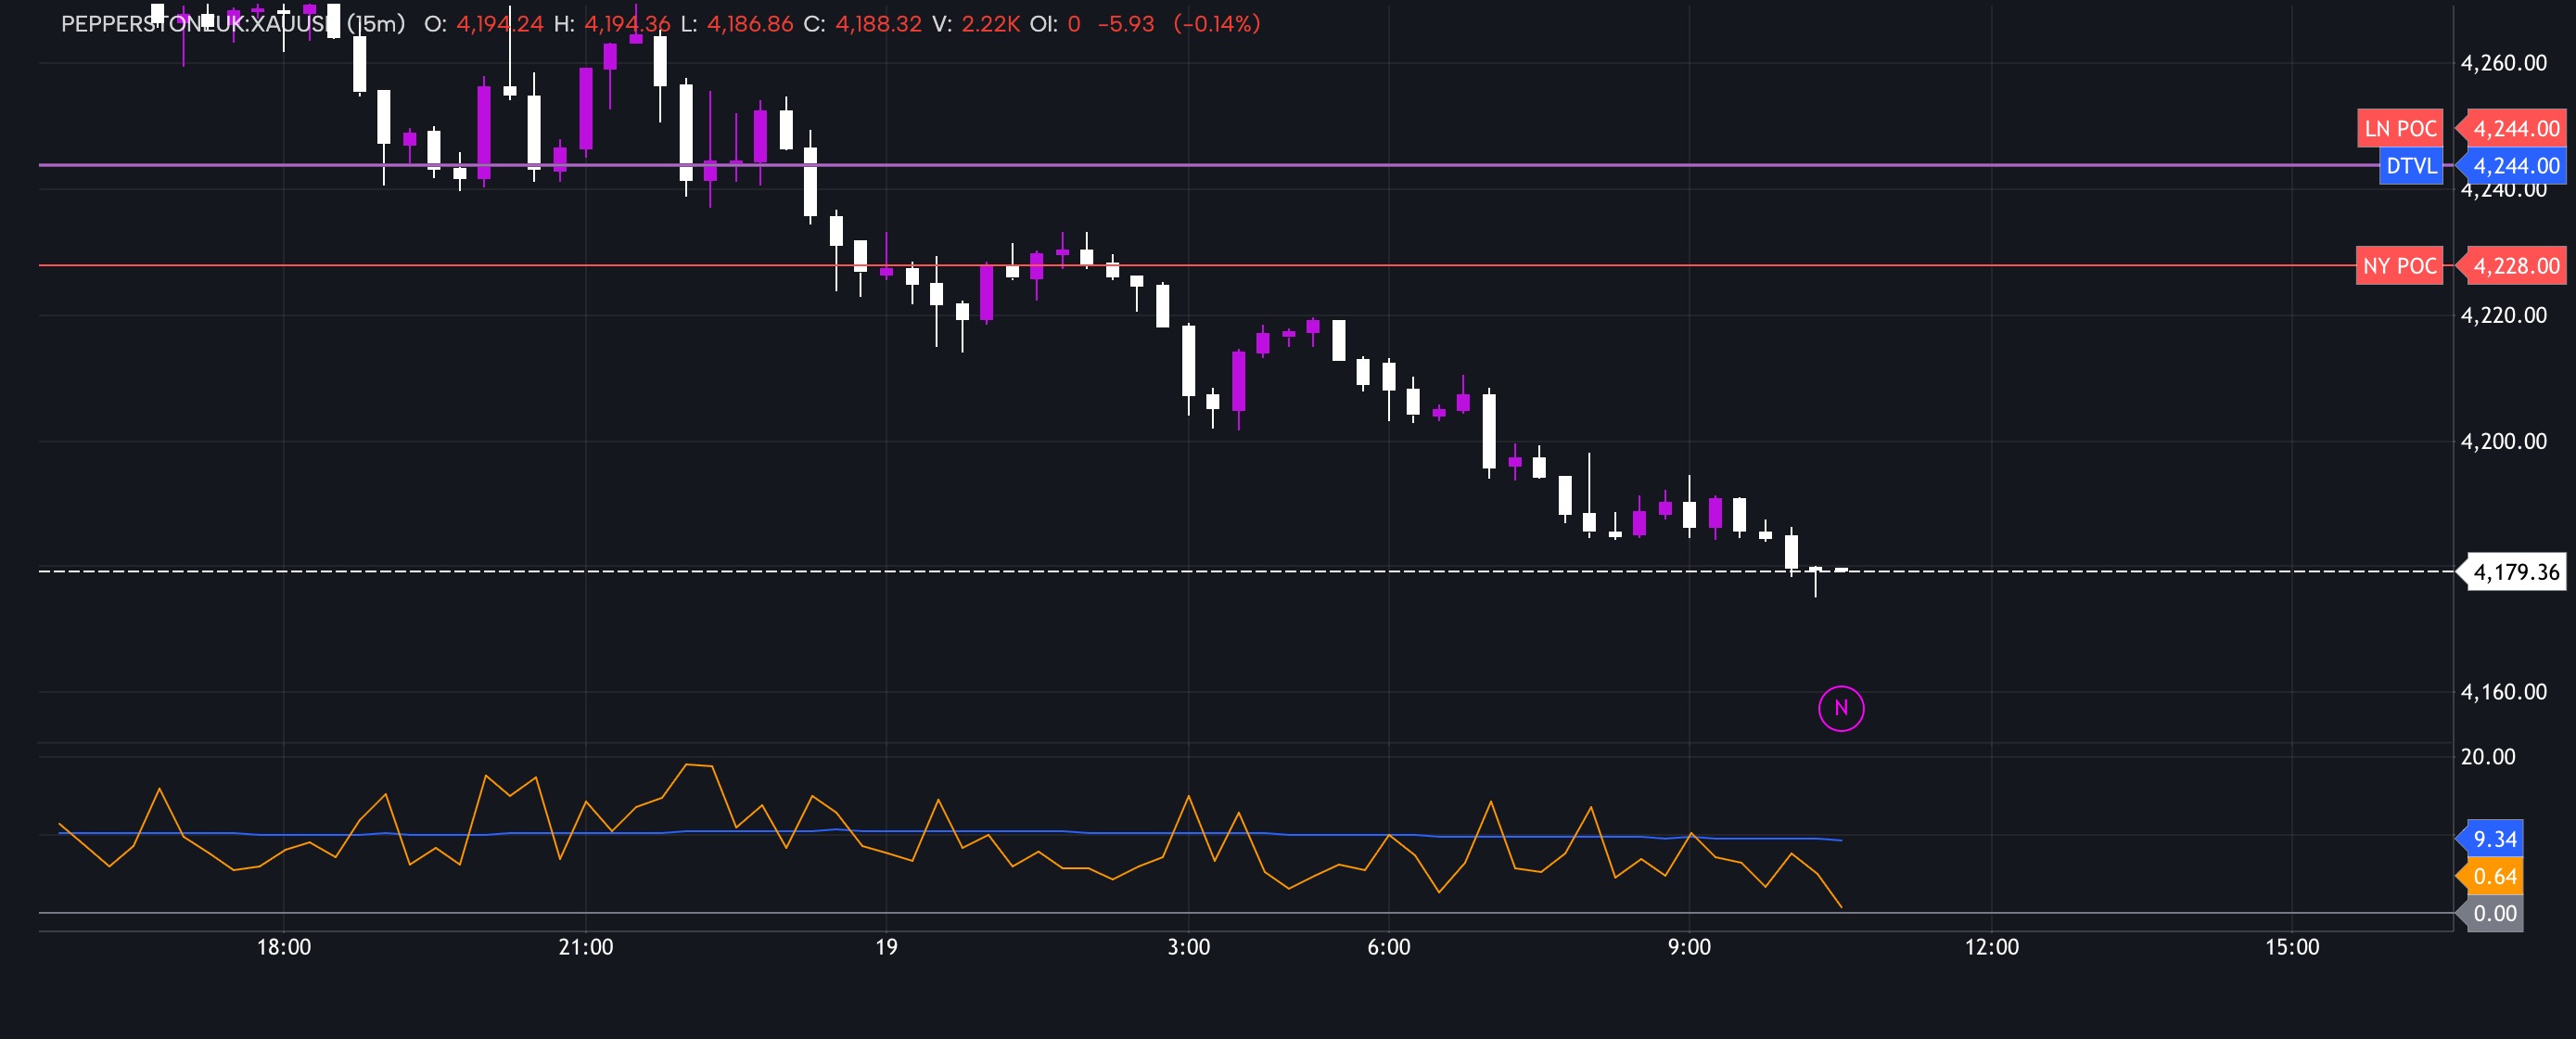
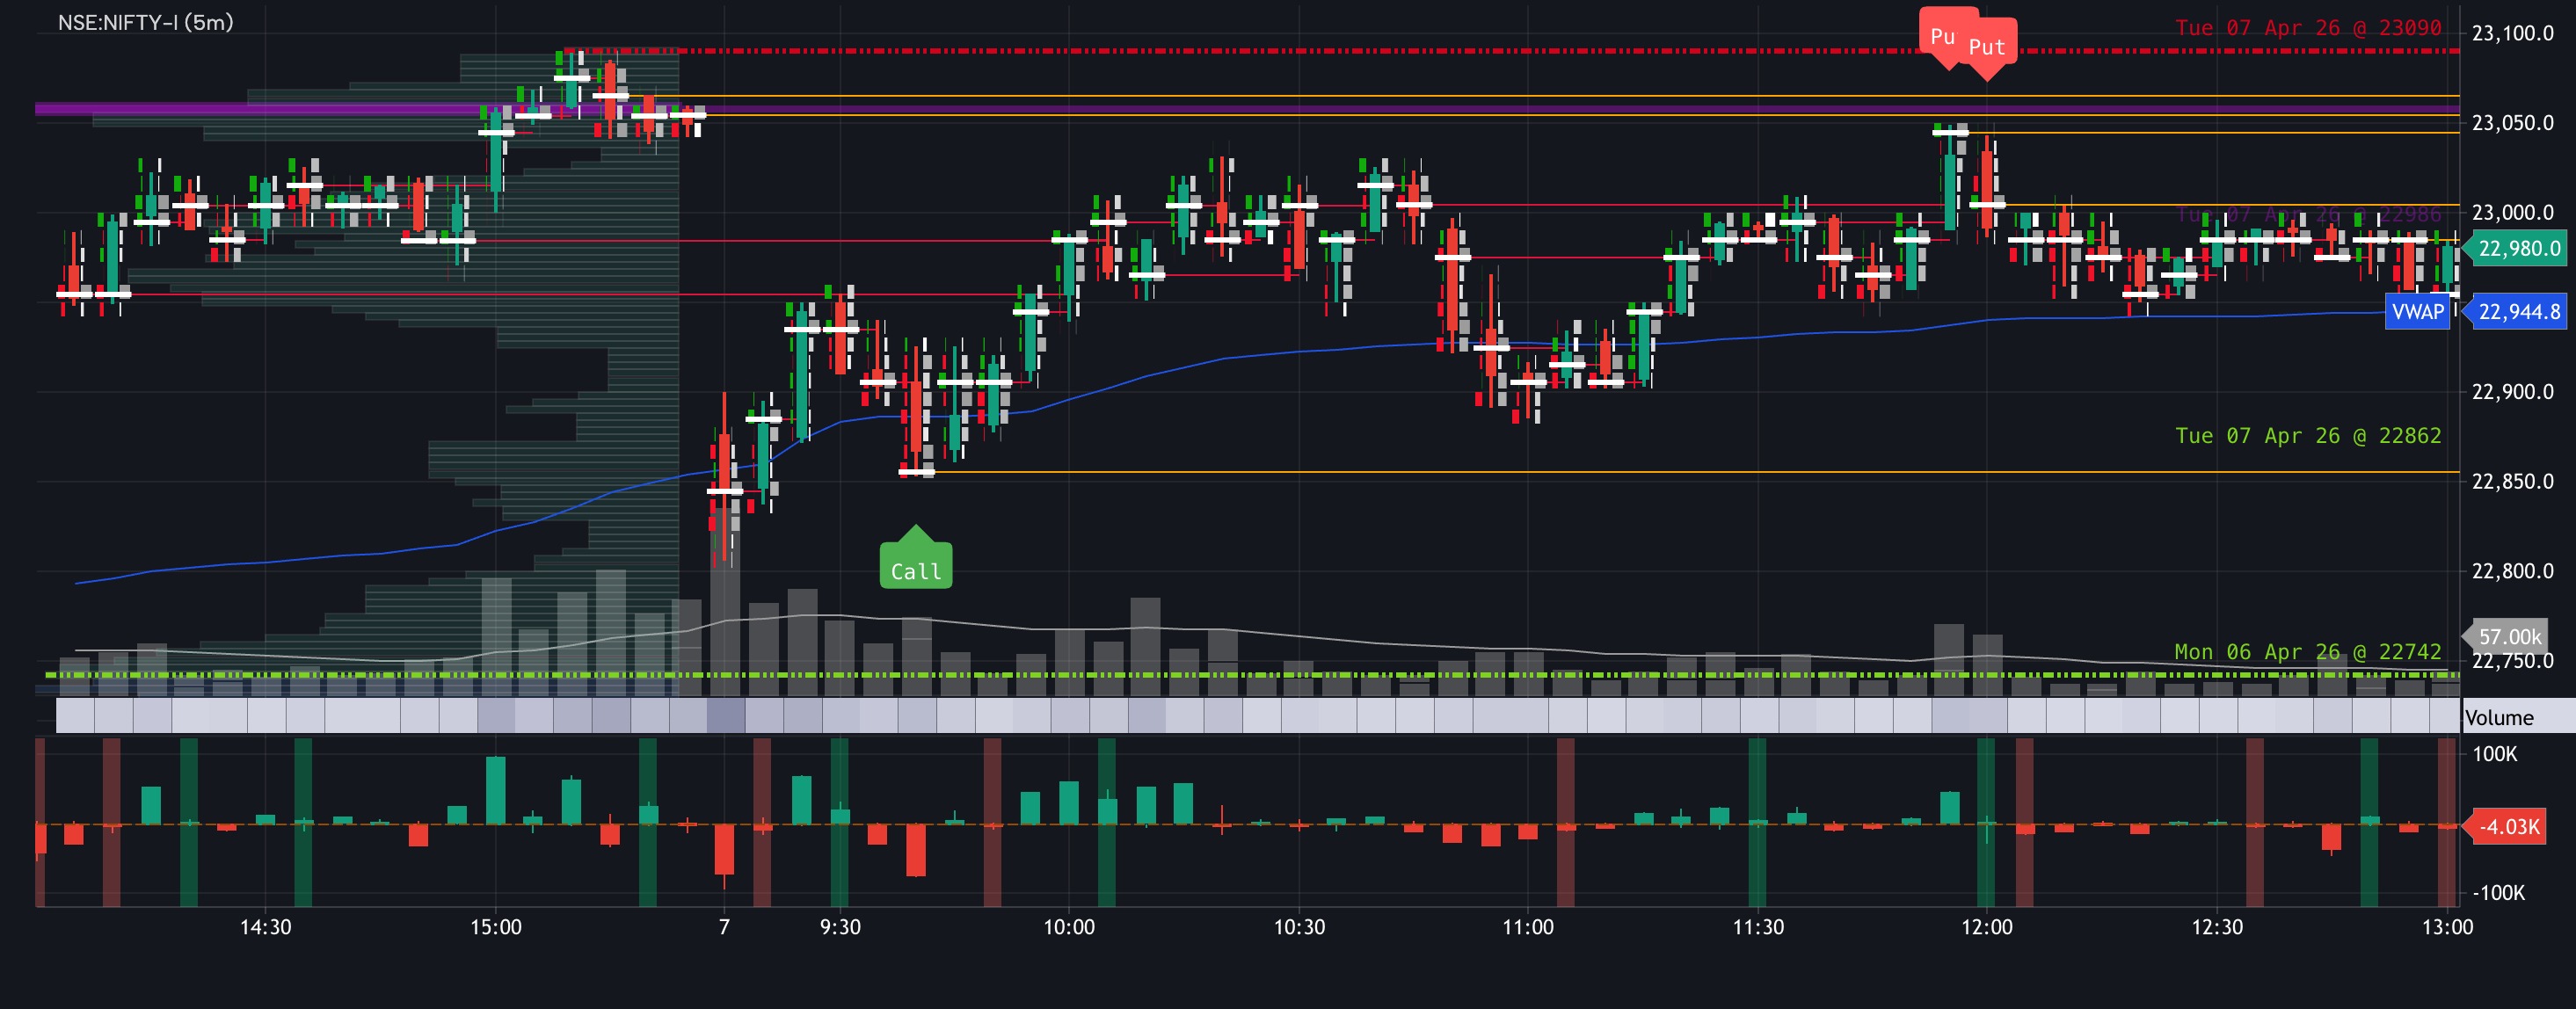
Trap Fade Reversal (TFR)
📊 Trap Fade Reversal Indicator : The Trap Fade Reversal Indicator (TFR) is designed to identify high-probability turning points in the market by analyzing volume footprint dynamics, delta imbalances, and trader aggressiveness. It highlights situations where one side of the market (buyers or sellers) becomes trapped, and fading that imbalance offers a reversal opportunity. 🔑 Core Features Volume Footprint Analysis: Tracks traded volume at each price level to reveal hidden buying or selling pressure. Delta Monitoring: Measures the difference between aggressive buyers and sellers to detect exhaustion or imbalance. Trader Aggressiveness: Identifies when market participants are chasing moves too aggressively, often leading to traps. Call & Put Signals: Generates clear reversal signals: Call (Buy) when sellers are trapped and aggressive selling fails to push price lower. Put (Sell) when buyers are trapped and aggressive buying fails to push price higher. 🎯 Trading Logic Trap Detection: Spots failed breakouts or breakdowns where aggressive traders are caught on the wrong side. Fade Setup: Signals a reversal entry against the trapped side, anticipating a move back toward equilibrium. Confirmation by Volume: Strong signals are validated by volume surges and footprint imbalances. ⚡ Benefits Helps avoid chasing false breakouts. Provides early warning of potential reversals. Enhances decision-making with objective, footprint-based signals.

Aggression Ration Analysis
📊 Aggression Ratio – What it shows This indicator measures market pressure by comparing selling volume vs buying volume: Ratio = Sell Volume / Buy Volume It reflects who is more aggressive in the market at any moment. 🔍 Interpretation Ratio > 1.0 (Red)→ Selling pressure dominates→ More aggressive sellers (potential bearish sentiment) Ratio → Buying pressure dominates→ More aggressive buyers (potential bullish sentiment) Ratio ≈ 1.0→ Balanced market (buyers ≈ sellers) ⚙️ Smoothing Logic Uses either: EMA (default) → faster, reacts quickly to changes SMA → smoother, slower response Smoothing helps reduce noise from raw order flow spikes. 📈 Visualization Column mode (default):Easy visual of shifting dominance between buyers and sellers. Optional ratio line:Helps track trend in aggression over time. Baseline at 1.0:Critical threshold separating bullish vs bearish pressure. 🧠 Practical Insight Sustained >1 → Strong selling trend / possible continuation down Sustained → Strong buying trend / possible continuation up Sharp spikes → Potential exhaustion or reversal zones Divergence vs price → Early signal of weakening trend ⚠️ Important Note
Euphoria & Capitulation
This indicator highlights potential capitulation and euphoria moments in the market using a combination of volume spikes and recent price extremes. It looks for unusually high volume compared to recent history (using a Z-score approach). If high volume occurs when price is near the lowest level of a recent window, it marks a capitulation signal (possible panic selling). If high volume occurs when price is near the highest level of a recent window, it marks a euphoria signal (possible excessive buying).
Open Interest Z Score
This indicator is not just measuring Open Interest—it’s contextualizing participation in a statistical way, turning raw OI into a behavioral signal about market positioning. 🧠 What it really represents Open Interest reflects how many contracts are open, but on its own it lacks meaning. This script transforms it into a Z-score, which effectively answers: 👉 “Is the current level of market participation unusually high or low compared to recent behavior?” So instead of absolute values, you’re reading deviations from normal participation. 📊 Behavioral structure of the indicator 🟣 Z-score line (main signal) This line shows how aggressively traders are entering or exiting positions relative to the past: When it rises → participation is expanding faster than usual When it falls → participation is shrinking or lagging This makes it a second-order indicator—it doesn’t track price, but the commitment behind price. 🟢 +Z level (upper band) This represents a statistical extreme in participation: Market is seeing abnormally high positioning activity Typically occurs when: Trends are strong and attracting traders Late-stage moves become overcrowded 👉 At this level, the market is often: Either in a powerful continuation phase Or approaching a saturation point where too many traders are on one side 🔴 -Z level (lower band) This represents unusually low participation: Traders are closing positions or staying inactive Often seen after: Liquidation events Trend exhaustion During sideways markets 👉 This reflects a lack of conviction, where the market is resetting before the next move. ⚖️ Market psychology behind it This indicator is best understood as a crowd positioning thermometer: High Z-score → “Everyone is getting involved” Low Z-score → “No one is interested” Markets tend to behave predictably at these extremes: Crowded conditions → fragile, prone to sharp moves Empty conditions → stable, but ready for expansion 🔗 Relationship with price (critical insight) The real power comes from combining it with price: 1. Price ↑ + Z ↑ Strong trend with real participation Indicates healthy continuation 2. Price ↑ + Z ↓ Price rising but participation dropping Signals weak move / potential trap 3. Price ↓ + Z ↑ Increasing positions in a falling market Can indicate aggressive shorting or panic selling 4. Price ↓ + Z ↓ Positions closing during decline Suggests selling pressure is fading ⚡ Nature of extremes The ±Z levels (like ±2) are statistically significant: They mark rare deviations, not normal behavior When reached, they often coincide with: Breakouts fueled by new positions Climax phases where positions become overcrowded But importantly:👉 Extremes don’t automatically mean reversal—they mean imbalance.
CVD Z Score
This indicator is a Z-score–normalized order flow tool, built around Cumulative Volume Delta (CVD) and per-bar delta, designed to measure how aggressive buying or selling is relative to recent history. 🧠 Core concept At its heart, this script tracks order flow imbalance: Buys (orderflow.buy) → aggressive market buying Sells (orderflow.sell) → aggressive market selling Delta = Buys − Sells → net aggression per candle It then standardizes this using a Z-score, so instead of raw numbers, you see:👉 “How extreme is current buying/selling compared to normal?” 📊 Two operating modes 1. useDeltaZ = true (default) Uses per-bar delta Focuses on short-term aggression spikes 👉 Best for: Scalping Spotting sudden buying/selling bursts 2. useDeltaZ = false Uses CVD (cumulative delta) Focuses on position buildup over time 👉 Best for: Trend confirmation Detecting sustained accumulation/distribution 📈 Z-score interpretation 🟢 Above 0 (green fill) Buying pressure dominates Positive delta relative to average Indicates buyers are more aggressive than usual 👉 Context matters: Rising price + positive Z → strong bullish participation Falling price + positive Z → possible absorption (hidden selling) 🔴 Below 0 (red fill) Selling pressure dominates Negative delta relative to average Indicates sellers are more aggressive than usual 👉 Context: Falling price + negative Z → strong bearish conviction Rising price + negative Z → possible hidden accumulation ⚡ Extreme values (|Z| > 2 or 3) Statistically rare events Signal unusual order flow imbalance These zones often precede: Liquidity grabs Exhaustion moves Sharp reversals or continuation bursts 🎛️ Smoothing logic The indicator applies optional smoothing: SMA smoothing → stable, less noisy EMA smoothing → faster, more reactive 👉 Effect: Reduces noise from raw delta spikes Makes trends in order flow easier to read 🎨 Visual structure Blue line (zLine) → normalized order flow strength Zero line (red) → neutral boundary Fill: Green → bullish dominance Red → bearish dominance This creates a momentum-style oscillator, but based on real trading activity, not price alone.