Orderflow Trading Platform with Footprint Charts & Delta
See traded volume and buying and selling pressure at each price, alongside market depth in the DOM. GoCharting brings Footprint charts, Delta, CVD, Volume Profile, DOM, Time & Sales, Market Profile and VWAP into one orderflow workspace.
Start Trading FreeFootprint & Cluster Charts for Orderflow Trading
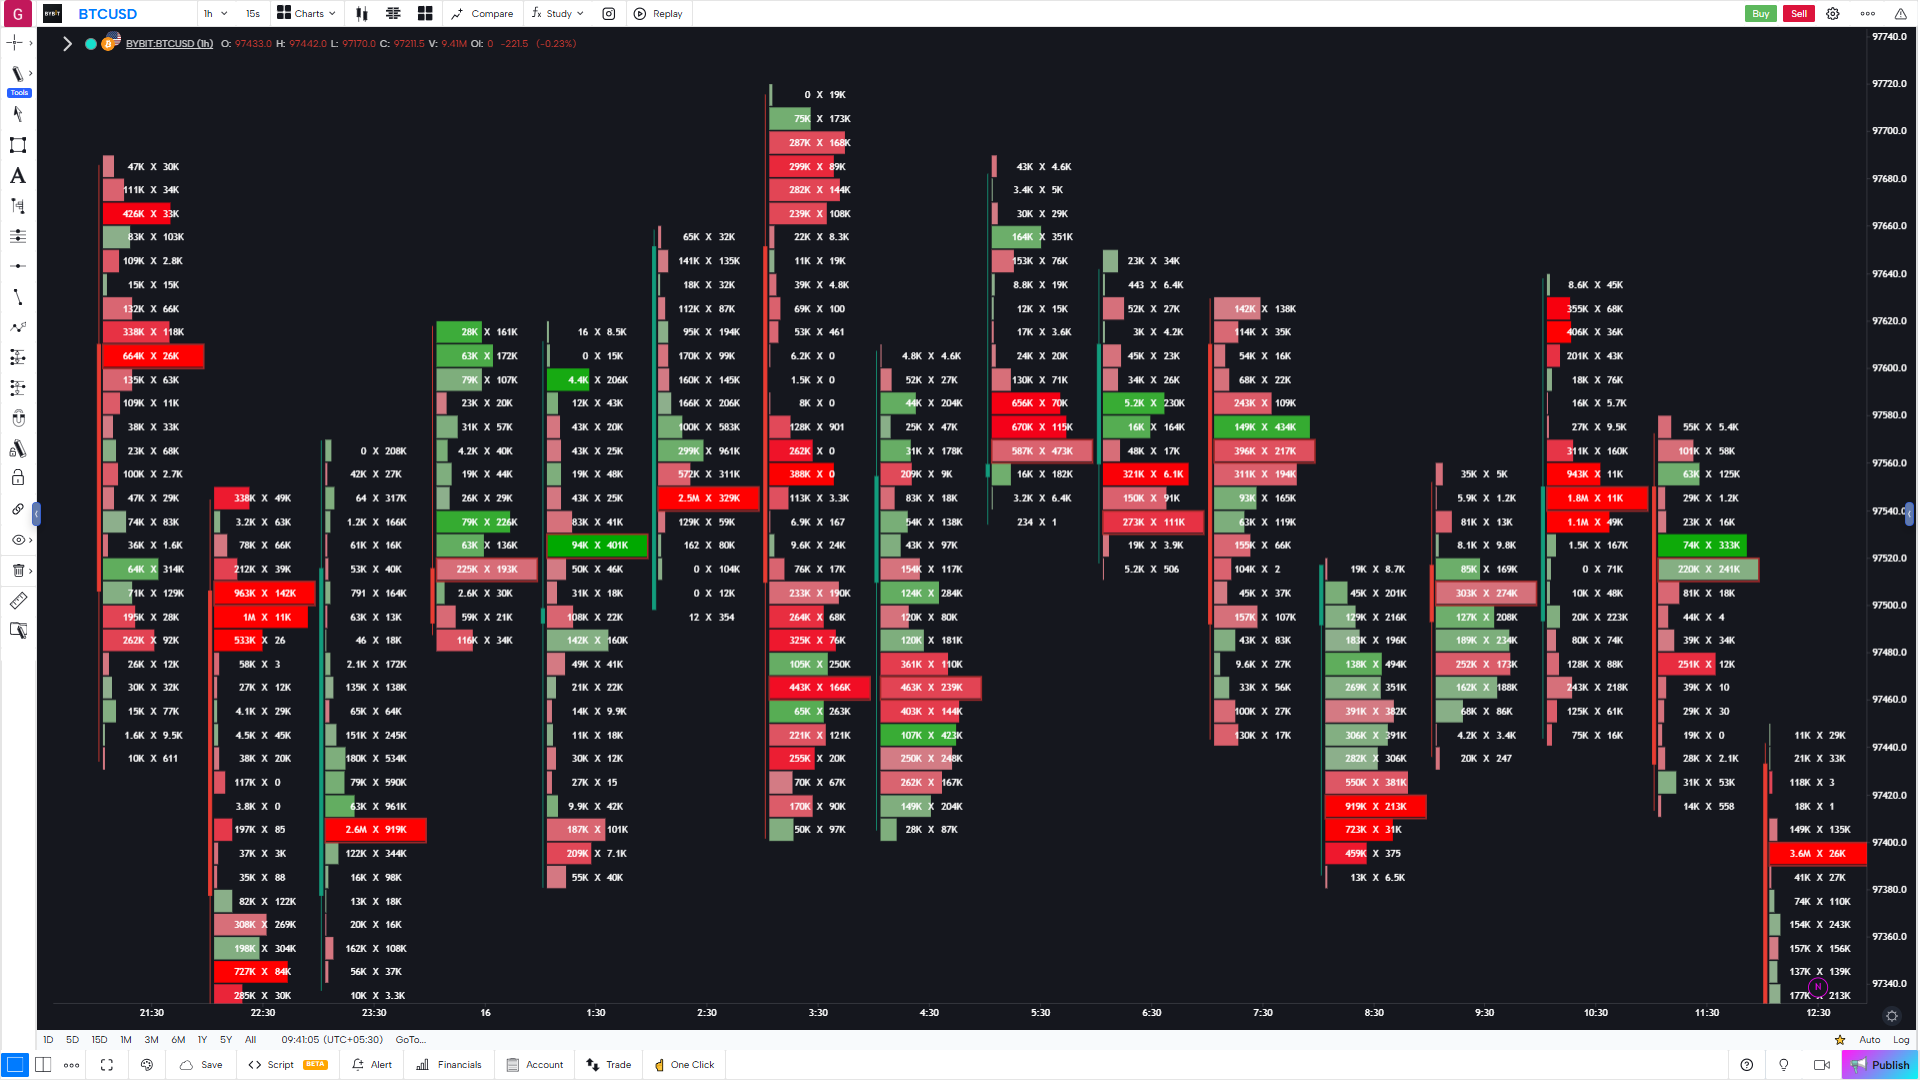
Footprint charts show volume traded at the bid and ask at each price level, helping traders read buying and selling pressure inside each candle.
- Each bar can be viewed "from the inside"
- 21+ metrics to choose from
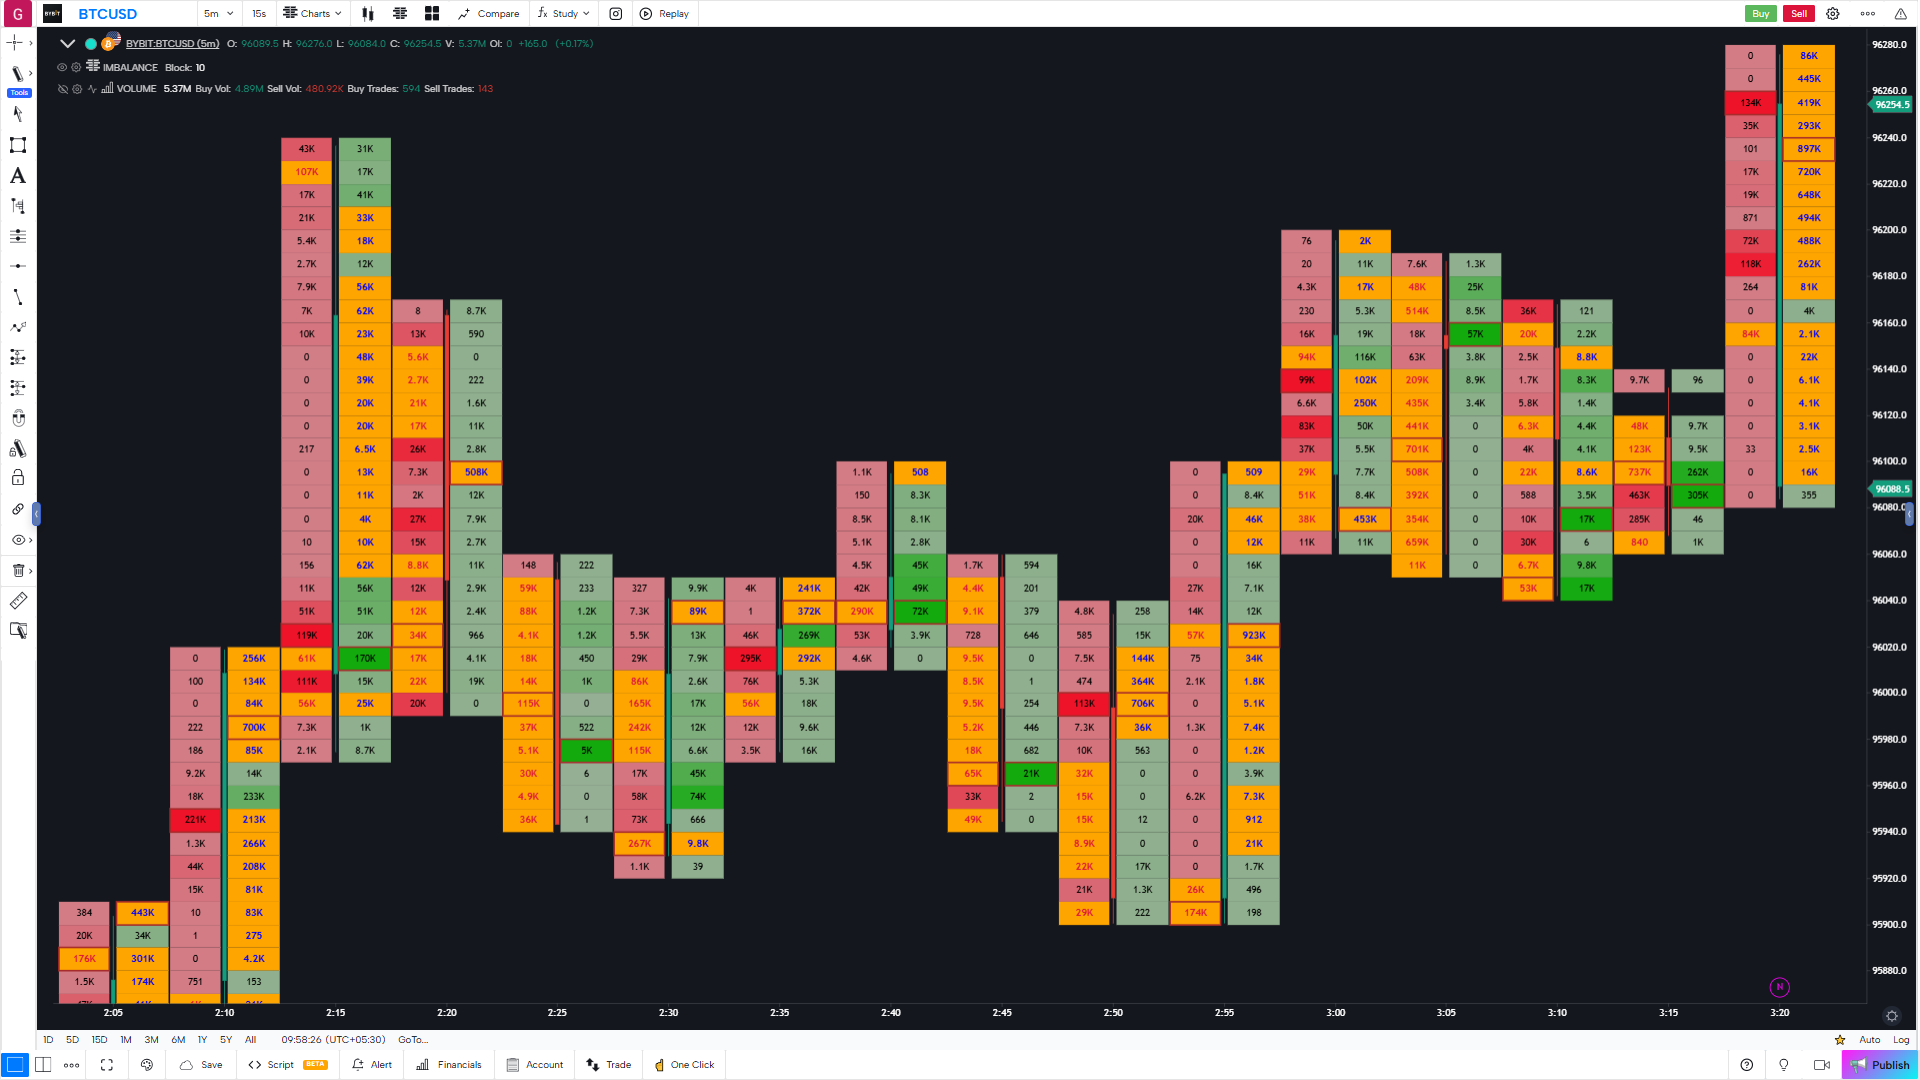
Imbalance Chart
Analyze trading volume at each price level and identify imbalances between buyers and sellers.
- Automated Resistance and Support
- Analyze market participant behavior
- Identify bid/ask volume imbalances at each price level.
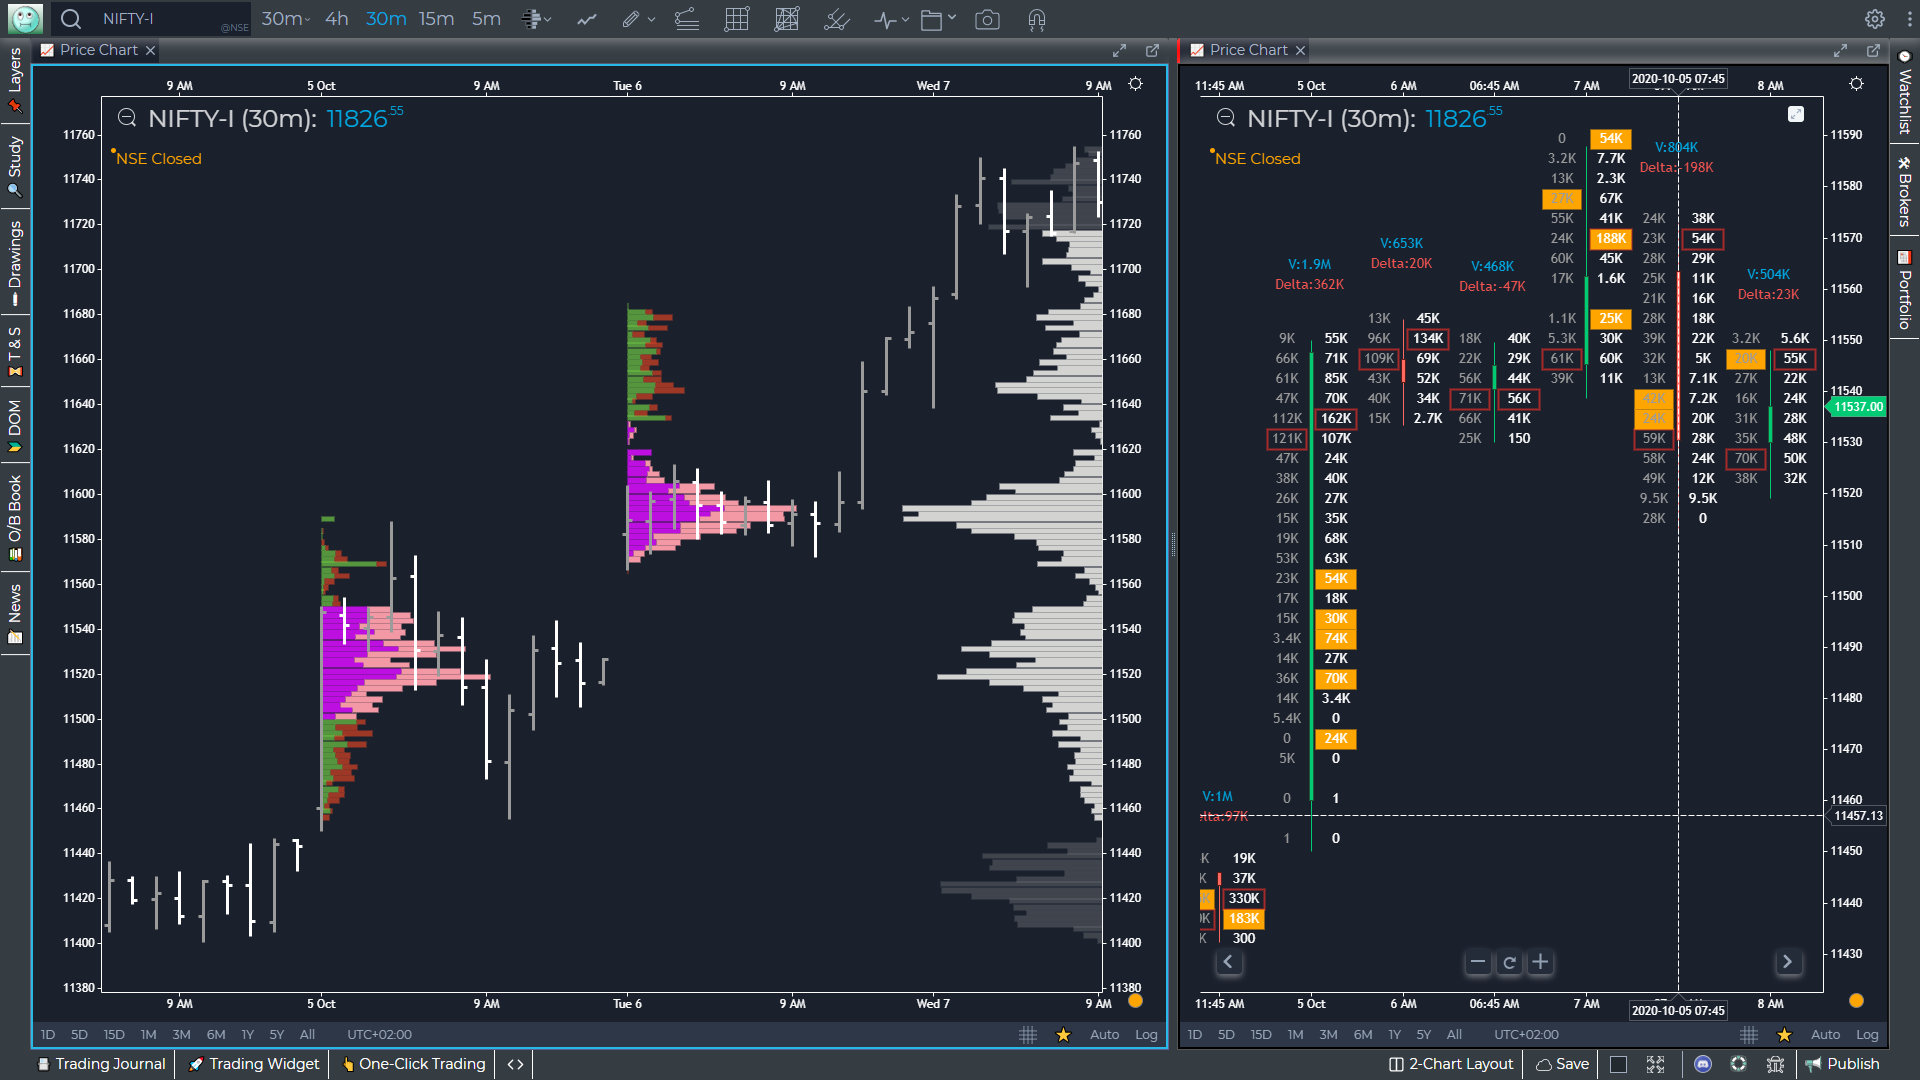
Session, Composite and Fixed Volume Profile
Add volume profile with various time periods, find the point of control (POC) and value area (VA). Visualise where the market spent the most time and traded the most volume — an indispensable tool for any orderflow trader.
- Point of Control (POC) — highest-volume price level for the session
- Value Area High & Low (VAH / VAL) — 70 % of volume range
- Anchor Volume Profile and Sessions Volume Profile
- Fixed Range Profile — draw over any custom bar selection
- Composite Profile — aggregate volume across multiple sessions
- Single Print detection for identifying thin, low-conviction zones
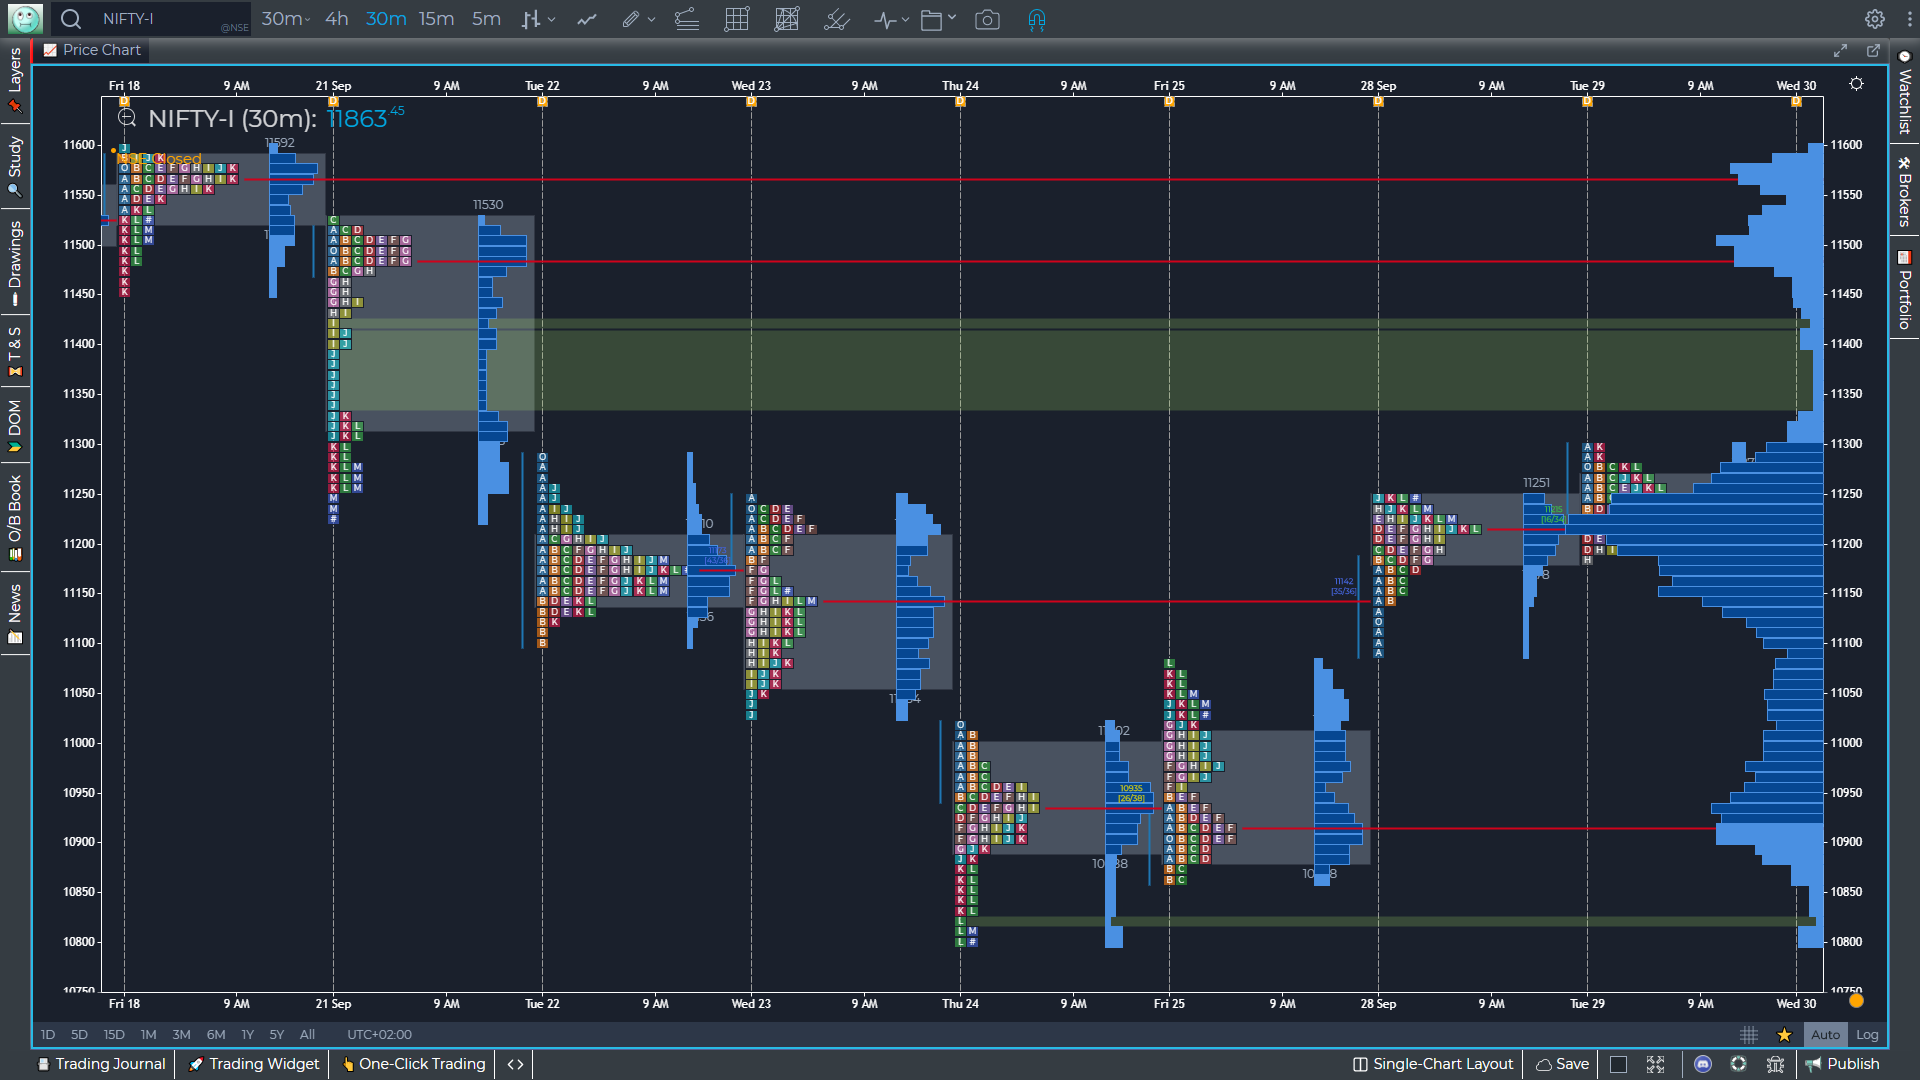
Market Profile aka TPO
Analyze the TPO Profile to understand the price distribution during the day or trading session
- Crucial SR price levels
- Point of Control, Value Area and Single Prints
- Merge and Unmerge TPO Profiles
Time & Sales & DOM
Use Volume Analysis Tools directly on the order flow chart
- Historical Time & Sales
- Advanced Depth of Market Panel
Delta & Cumulative Volume Delta (CVD)
Delta measures the net difference between aggressive buying and selling volume inside each bar. Cumulative Volume Delta (CVD) tracks that difference over time.
- Bar Delta — net buy vs. sell volume for each bar, color-coded green/red
- Cumulative Delta (CVD) — running tally that reveals sustained directional pressure
- CVD Divergence — spot when price makes new highs but CVD is declining (and vice versa)
- Delta Exhaustion — detect exhausted moves where delta spikes but price stalls
- Histogram mode overlaid directly beneath each bar for at-a-glance reading
- Alert when bar Delta exceeds a custom threshold
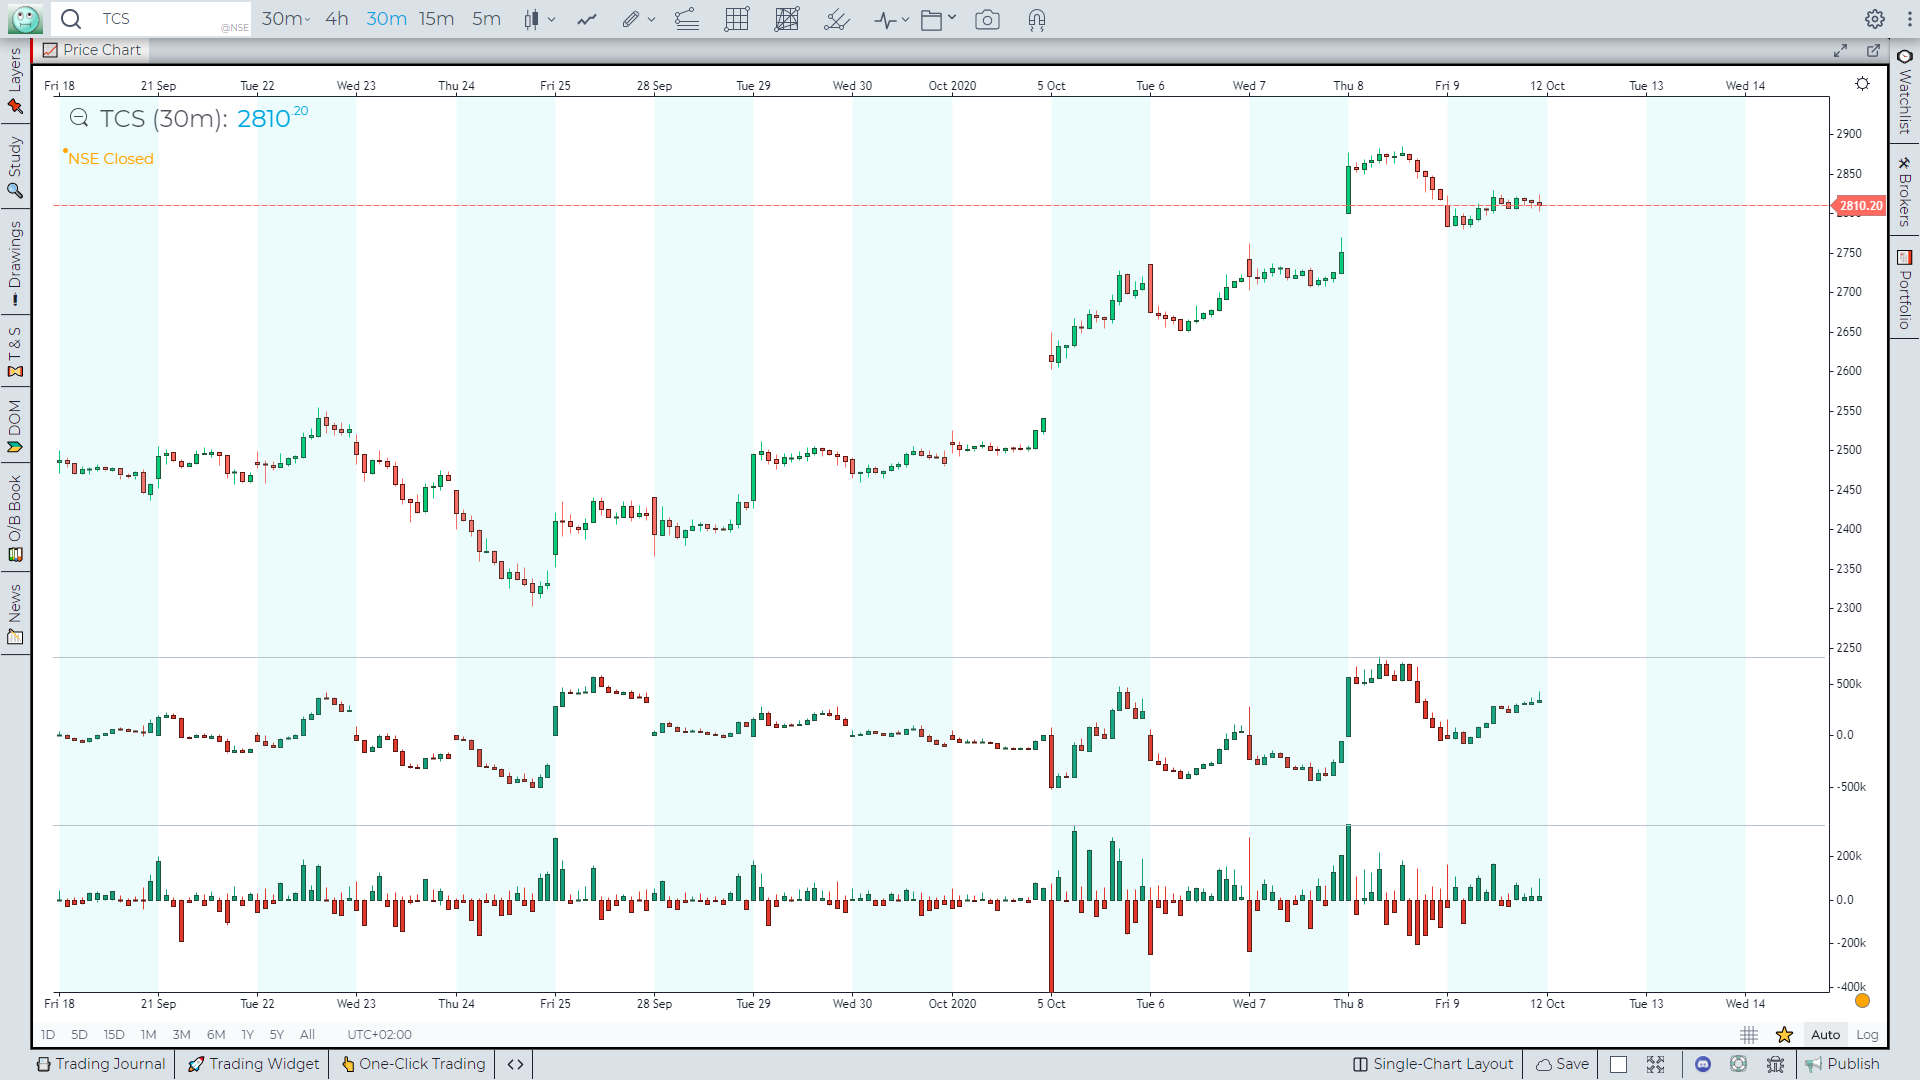
Bar Statistics & Histograms
Every bar carries a wealth of data beyond open, high, low, close. Bar Statistics surfaces that hidden context directly on the chart so you can evaluate conviction, participation and pressure at a glance.
- Volume per bar — total contracts / shares traded in each candle
- Number of Trades — transaction count reveals market participation intensity
- Delta per bar — net buying minus selling for precise imbalance analysis
- Max bid & max ask — largest single-tick size on each side of the tape
- Volume histograms rendered inside each bar for instant visual comparison
- Tooltip drill-down — hover any bar for the full statistical breakdown
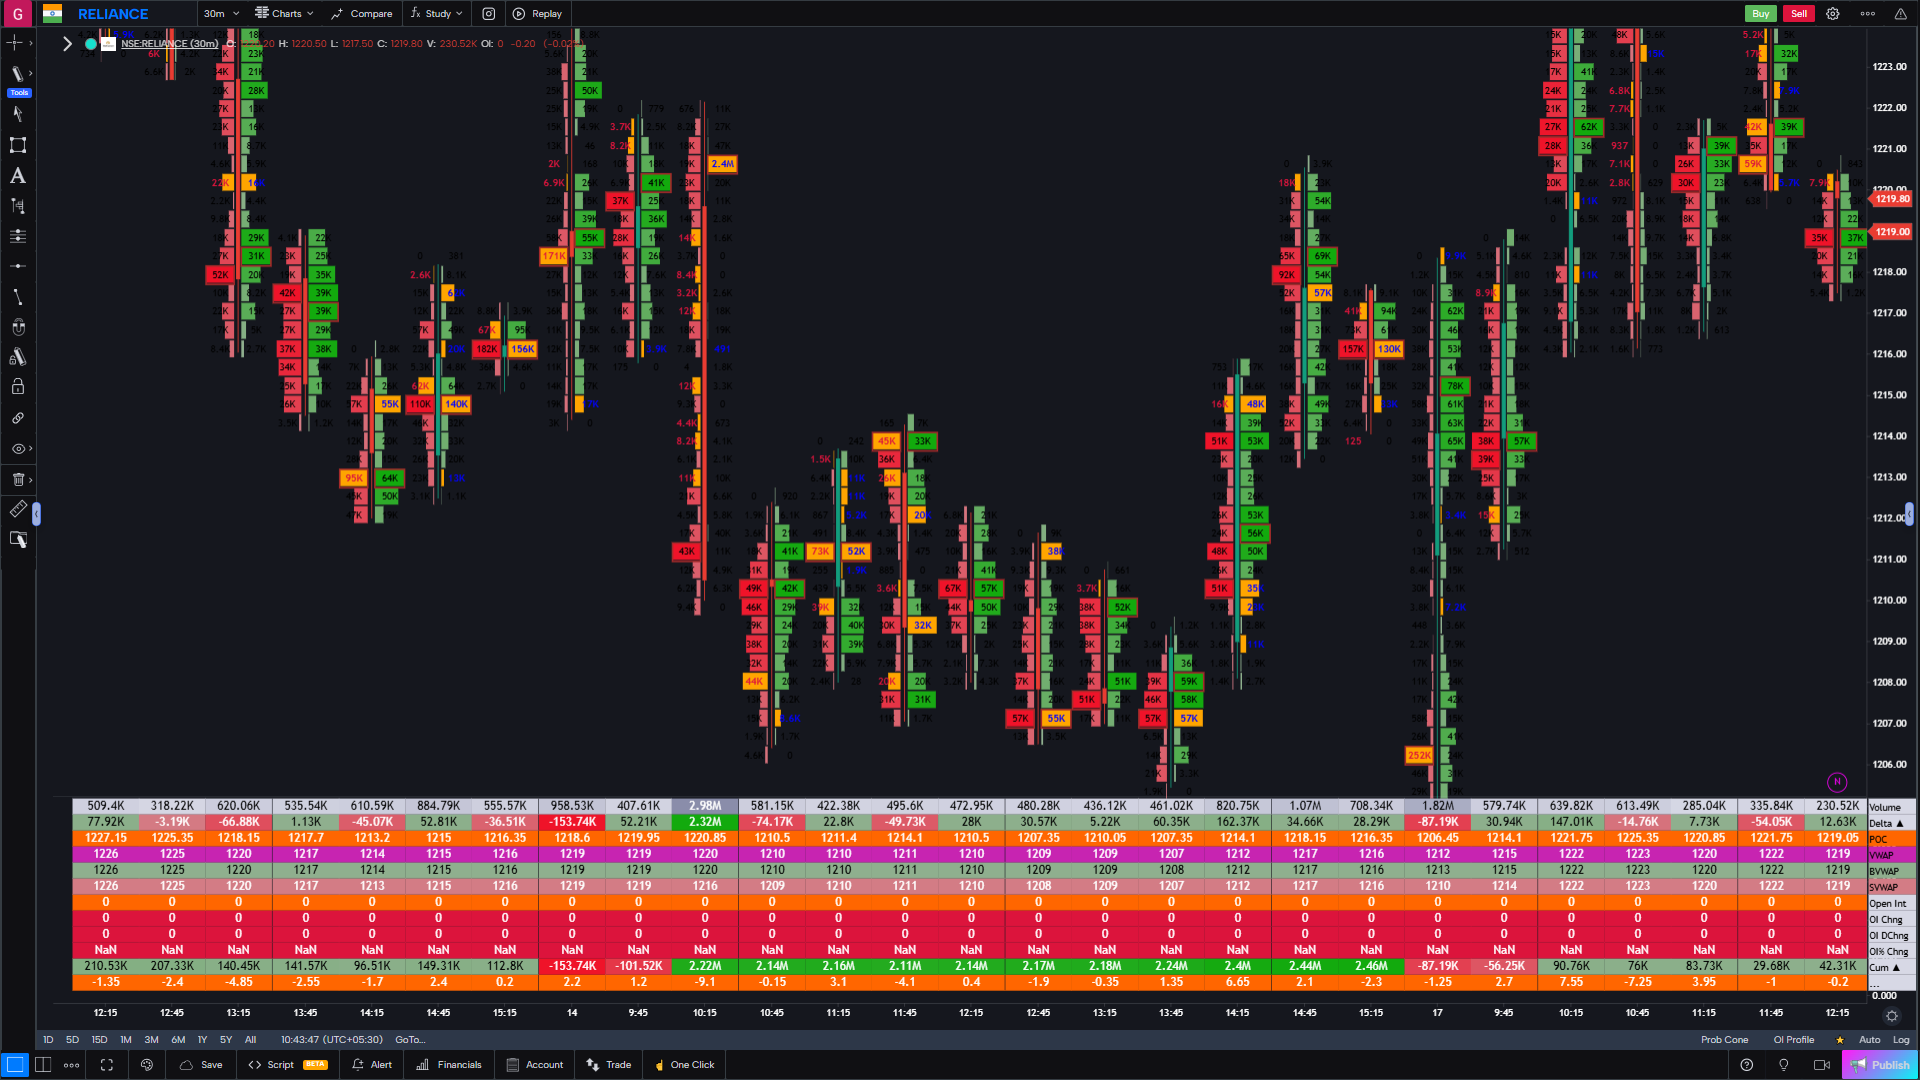
Power Trades and Support/Resistance Lines
Power Trades highlights high-volume trades that meet your custom size threshold. GoCharting can also plot Support and Resistance levels from detected orderflow imbalances.
- Power Trade markers — flag every print above your custom size threshold
- Configurable minimum size so you filter noise and see only the moves that matter
- Auto S/R lines — drawn at price levels where persistent imbalances occurred
- Imbalance-based levels update dynamically as new data arrives
- Combine with Footprint and Delta for full-context execution analysis
- Alert when a Power Trade condition is detected
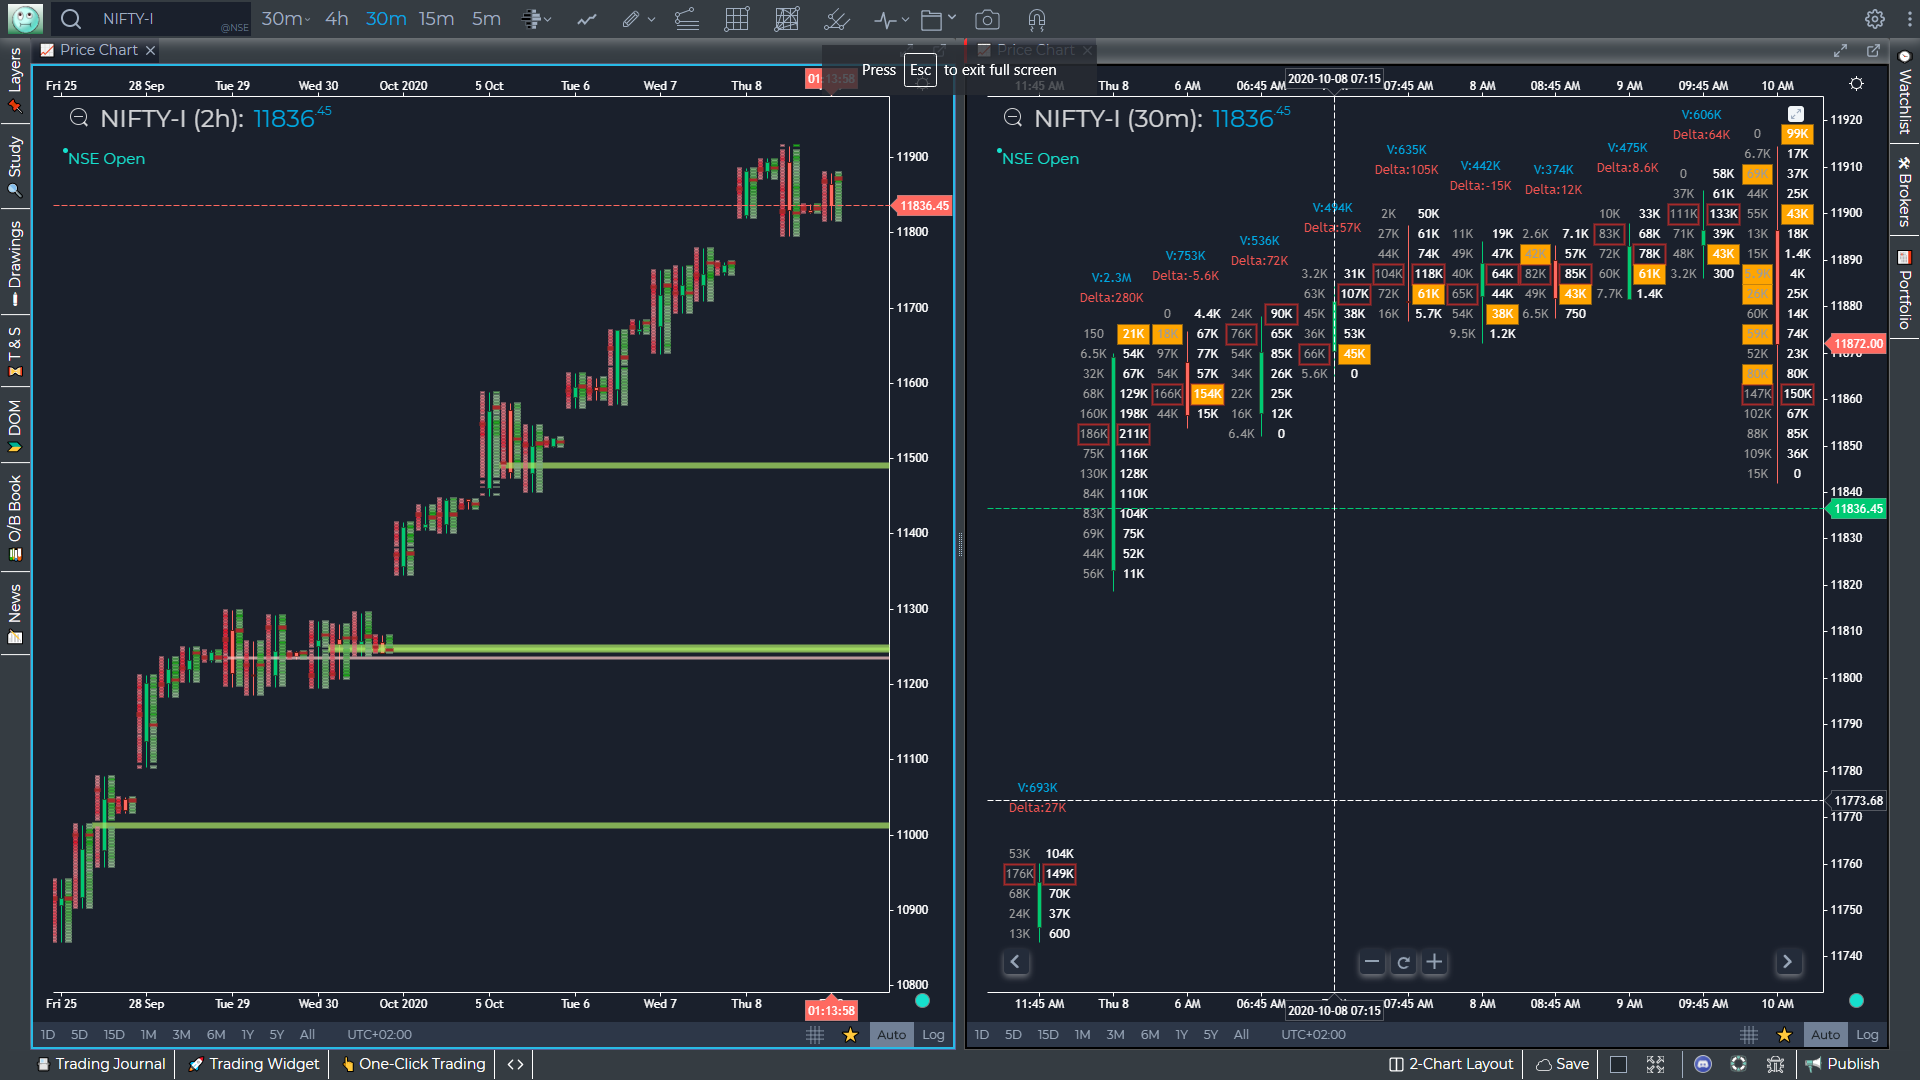
VWAP, Anchor VWAP and VWAP Bands
VWAP is the volume-weighted average price of trades over a selected period. GoCharting supports Session VWAP, Anchored VWAP and VWAP Bands.
- Session VWAP — the classic intraday benchmark, resets at market open
- Anchor VWAP — pin VWAP to any bar: earnings, highs, lows or key events
- Daily / Weekly / Monthly VWAP overlays on a single chart simultaneously
- Standard Deviation Bands (1σ, 2σ, 3σ) to define fair-value ranges
- Volume-weighted Value Area High & Low rendered alongside VWAP
- Multi-VWAP confluence zones — compare overlapping VWAP levels from different anchors
How Orderflow Works
Get a clear, visual walkthrough of Orderflow — what it is, how to read it, and how professional traders use footprint charts and delta to decode market intent.
Frequently Asked Questions
What is Order Flow / Footprint charting?▾
Order Flow charts (also called Footprint charts) show the volume traded at each price level inside every candle — split into buy volume and sell volume. This reveals real buying/selling pressure invisible on standard OHLC charts.
Does GoCharting support real-time tick data for Order Flow?▾
Yes. GoCharting streams true tick-by-tick data from CME, NSE, crypto exchanges and more, so Footprint charts update in real time — no approximations or synthetic data.
Which Order Flow indicators are available?▾
GoCharting includes Delta, Cumulative Volume Delta (CVD), Volume Profile, VWAP, Imbalance detection, Absorption and custom Lipi-based Orderflow scripts.
Can I use Order Flow on crypto and equity markets?▾
Yes. Order Flow is available across crypto (Bybit, Binance), CME futures, NSE/BSE equities, and forex pairs — wherever tick data is available.
Is Order Flow analysis free on GoCharting?▾
Basic Footprint charts are included in the free plan. Advanced metrics like real-time Delta clusters, Volume Profile with multiple anchors, and Imbalance highlighting require a premium subscription.