Advanced Features Built for Every Trader
From professional charting tools and order flow analytics to live options trading — GoCharting is the most complete platform for serious traders.
Start Trading FreeOptions Trading and Analytics
World's most beautiful Options Trading Platform on the web
- Advanced and customizable Options Chain
- Options Flow and Open Interest Analysis
- Add 30 pre-built metrics on the Chain
- Trade directly from the Chain with ease
Gamma Exposure & More
Advanced analytical metric on GEX, PCR, OI and more
- Gamma Exposure based on OI and Volume
- Cumulative OI Analysis
- Put/Call Ratios
Strategy Analyzer and PayOff Chart
Create complex option strategies on the fly and analyze PnL in Paper/Real Trade mode
- Create custom strategies saved on the cloud
- 40+ pre-built popular option strategies
- Interactive PayOff Chart
- Greek overlay curves to the PayOff chart
Volatility Skews and Surface
Implied Volatility is never flat — it smiles, smirks and shifts across strikes and expiries. The GoCharting volatility surface lets you see exactly where the market is over- or under-pricing risk and exploit those edges.
- IV Skew chart — compare implied volatility across all strikes in one glance
- Multi-expiry overlay — plot 30d, 60d and 90d curves simultaneously
- 3D volatility surface — scroll and rotate the full strike × expiry landscape
- Historical vs. current IV comparison to spot regime changes
- Term structure view — see if front-month IV is elevated vs. back month
- Identify mispriced options where skew deviates from fair-value model
Multistrike Charts
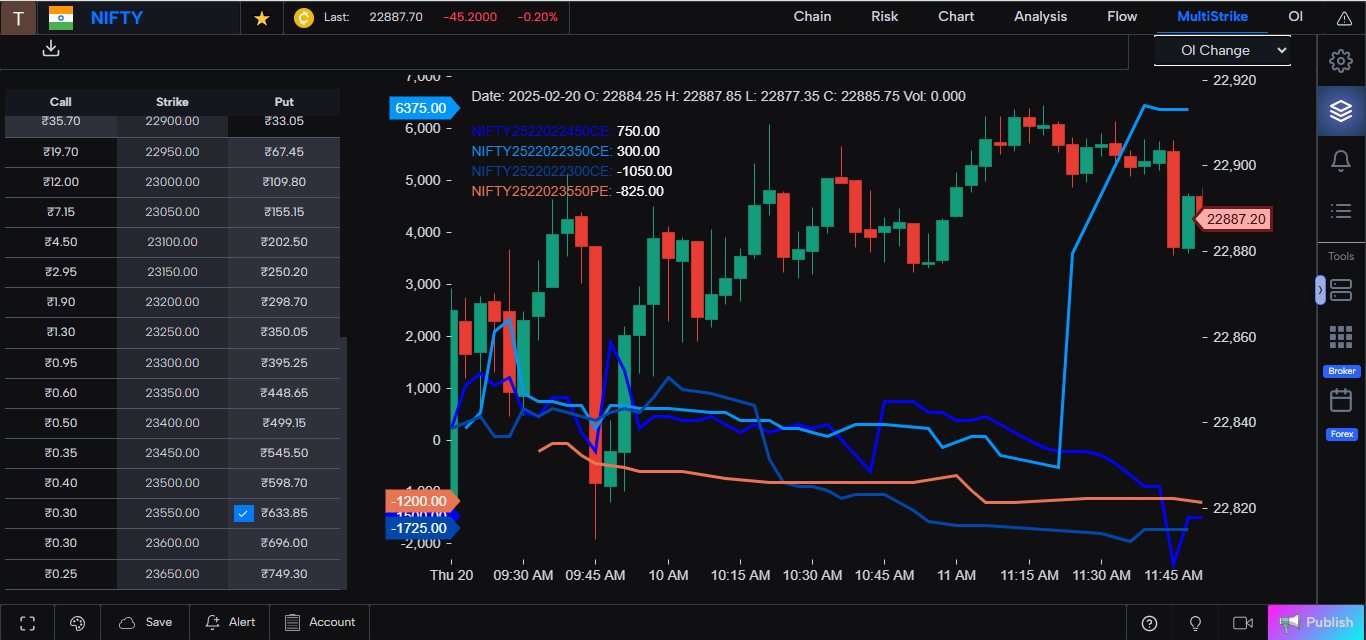
Multistrike Charts uniquely fuse options analytics with GoCharting's world-class orderflow tools — plot OI, volume and delta for multiple strikes directly on a price chart in one unified canvas.
- Overlay Open Interest for any strike on the underlying price chart
- Compare Call vs. Put OI build-up at key strikes side by side
- Add volume and delta series for each strike as separate sub-panels
- Combine with Footprint and Market Profile for full-context reads
- Automatically highlights max-pain and gamma-heavy price levels
- Trade directly from the chart without switching to the chain view
Options Flow
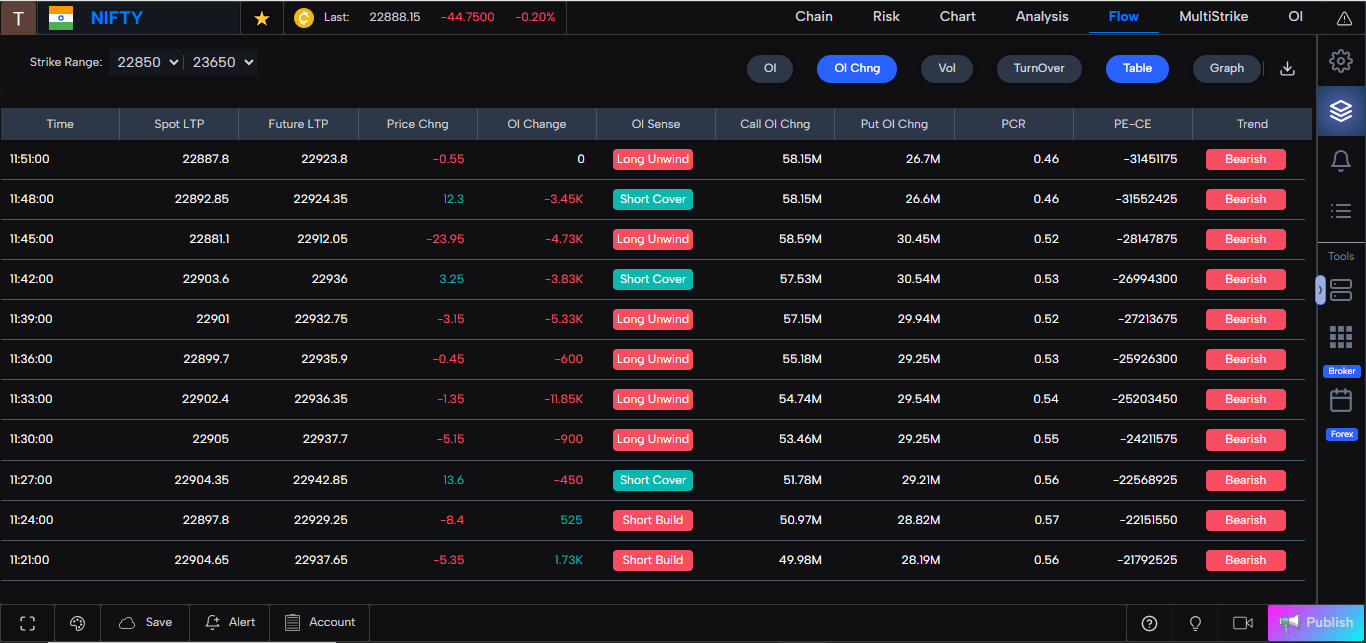
Options Flow is real-time intelligence on what smart money is doing. Track where fresh OI is being built, where large premiums are changing hands, and which strikes are attracting unusual activity — before the move happens.
- Real-time OI and Volume flow streamed tick by tick across all strikes
- Unusual activity scanner — flags prints significantly above average size
- Net premium flow — total dollars transacted on calls vs. puts per expiry
- Block trade detection — highlights large single-transaction option buys/sells
- Historical flow comparison to gauge whether today's activity is elevated
- Filter by expiry, strike range, premium size and call/put direction
Frequently Asked Questions
What is GoCharting OptionsDesk?▾
OptionsDesk is GoCharting's purpose-built options trading platform. It combines an options chain, payoff diagram builder, Greeks analysis, and one-click order placement — all in one integrated view.
Which options markets does GoCharting support?▾
GoCharting supports NSE options (Nifty, BankNifty, stocks), CME futures options, and crypto options via connected brokers. Real-time Greeks and IV data are streamed live.
Can I analyse multi-leg options strategies on GoCharting?▾
Yes. The Payoff Builder lets you add multiple legs (spreads, straddles, strangles, butterflies, condors) and visualises the combined P&L curve, max profit, max loss and breakeven points.
Does OptionsDesk integrate with my broker?▾
Yes. OptionsDesk connects to all supported GoCharting brokers — including Zerodha, Upstox, Angel One, Dhan and others — allowing one-click execution of single and multi-leg strategies directly from the payoff builder.
Is OptionsDesk free to use?▾
The options chain view and basic Greeks analysis are free. Advanced features like live IV surface, historical payoff analysis, and multi-leg basket orders require a premium plan.