Open Interest (OI)
Overview
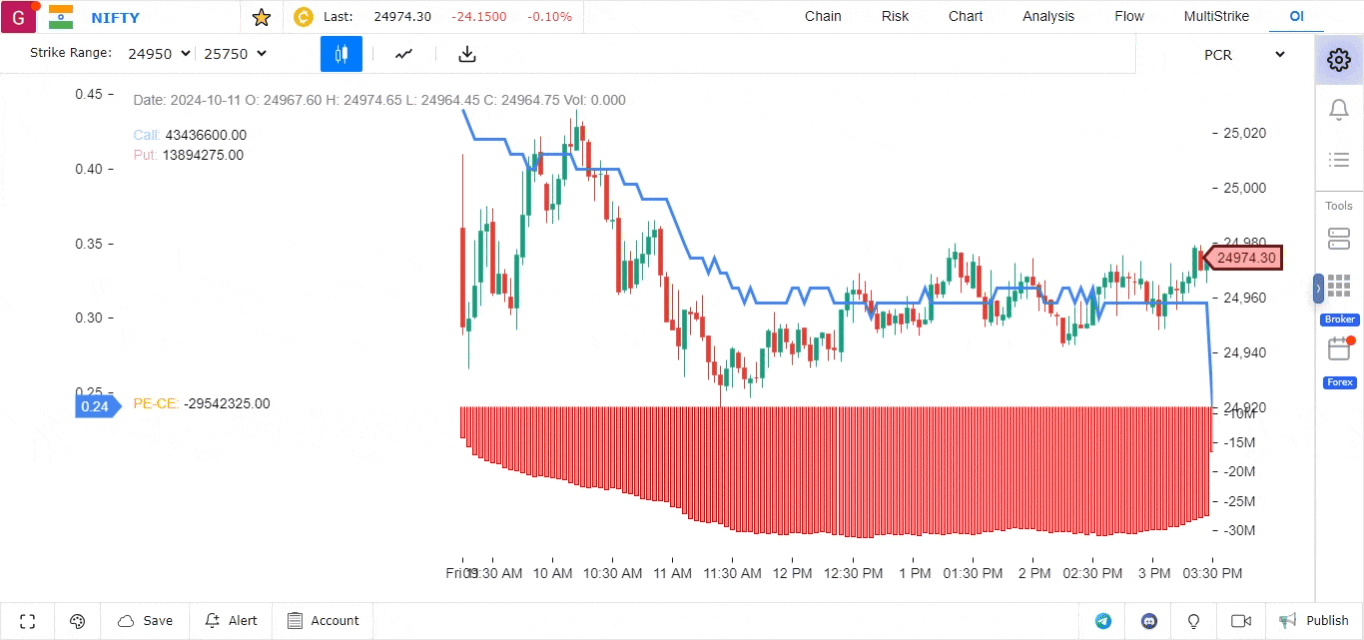
The Open Interest (OI) feature is designed to help traders analyze options data for a specific range of strike prices. By focusing on OI and related metrics, traders can gain insights into market sentiment and make more informed trading decisions.
Features of the OI Tool
1. Strike Price Range Selection
- On the top-left corner of the OI tab, you can select a range of strike prices to focus your analysis.
- This allows you to filter the data and concentrate only on the strike prices that are most relevant to your trading strategy.
2. Data Display
The top-right corner of the OI tab provides a clear view of key metrics for the selected strike price range:
- Open Interest (OI): Displays the total number of outstanding contracts for the chosen strikes.
- OI Change: Indicates how much the OI has increased or decreased over time.
- Put/Call Ratio (PCR): Shows the ratio of put options to call options, helping to gauge market sentiment.
3. OI Difference Analysis
At the bottom of the OI tab, you can see the difference in OI and OI change between calls and puts:
- This metric provides a quick comparison of market activity in call and put options.
- It helps in identifying whether there is a bullish or bearish bias in the options market for the selected strike range.
4. Change of Chart Type
- The underlying chart can be viewed in the form of a candlestick or a simple line chart.
Conclusion
The Open Interest (OI) feature is a valuable tool for options traders looking to analyze market activity within a specific range of strike prices. With its focused data on OI, OI change, and Put/Call Ratio, along with a detailed comparison of calls and puts, this feature allows for deeper insights into market trends and sentiment.
Use Case
Open Interest data in GoCharting’s Options Desk shows the total number of outstanding contracts at each strike and expiry, revealing where market participants have the heaviest exposure. It is used to identify key support/resistance levels and anticipate gamma hedging flows.
Strategy
Identify the strike with the highest call open interest (resistance) and highest put open interest (support). Near expiry, these act as gravitational levels that pull price toward the max pain level. Use OI changes (delta OI) to track whether new positions are being added or unwound at key strikes.
Common Mistakes
Do not use open interest data alone to predict price direction — OI shows positioning, not bias. Avoid ignoring that large OI positions can be unwound rapidly, removing the gravitational effect. Do not overlook the difference between static OI and the daily change in OI, which provides more actionable information.