Options Probability Cone
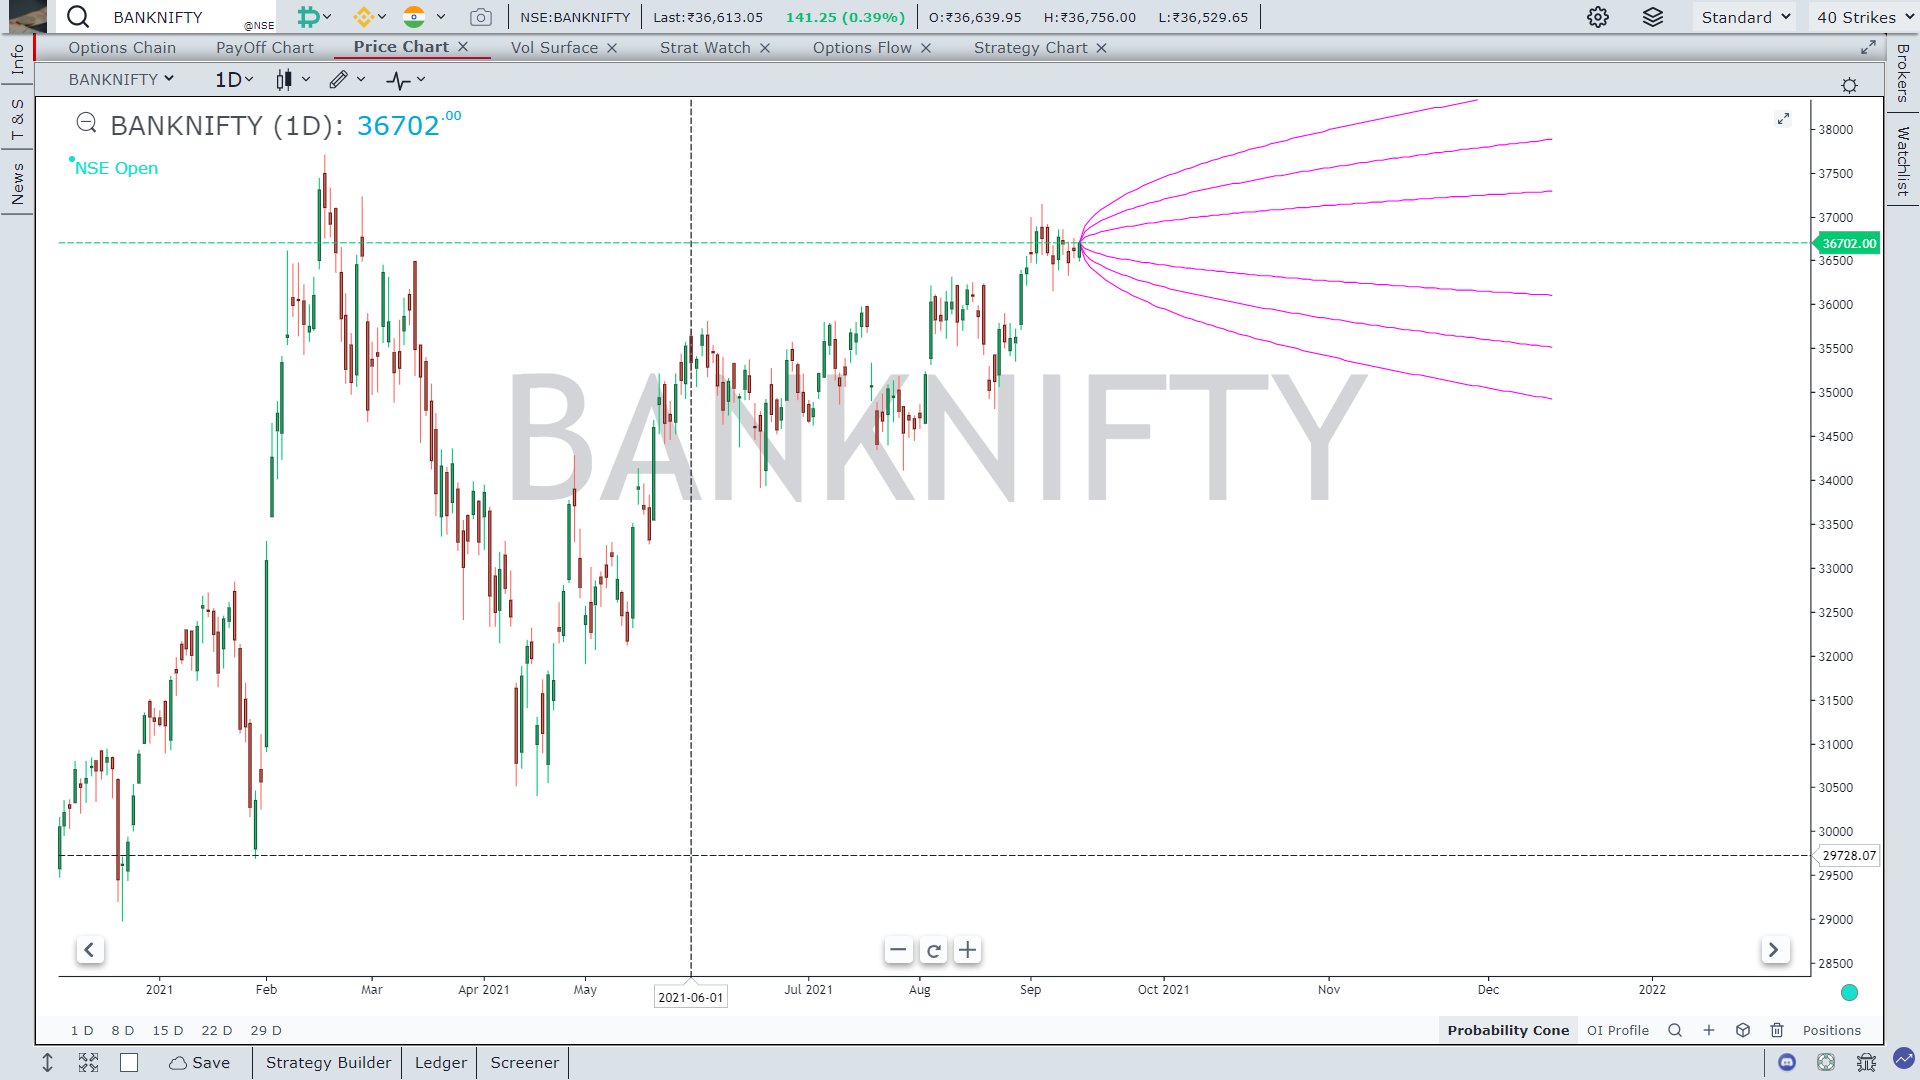
A probability cone uses historical option data and a statistical formula in order to the graph the potential future range for stock prices. The main purpose of the Probability Cone is to provide a graphic representation of odds for an individual market to reach a price and time projection.
Image shows the Probability Cone on NIFTY
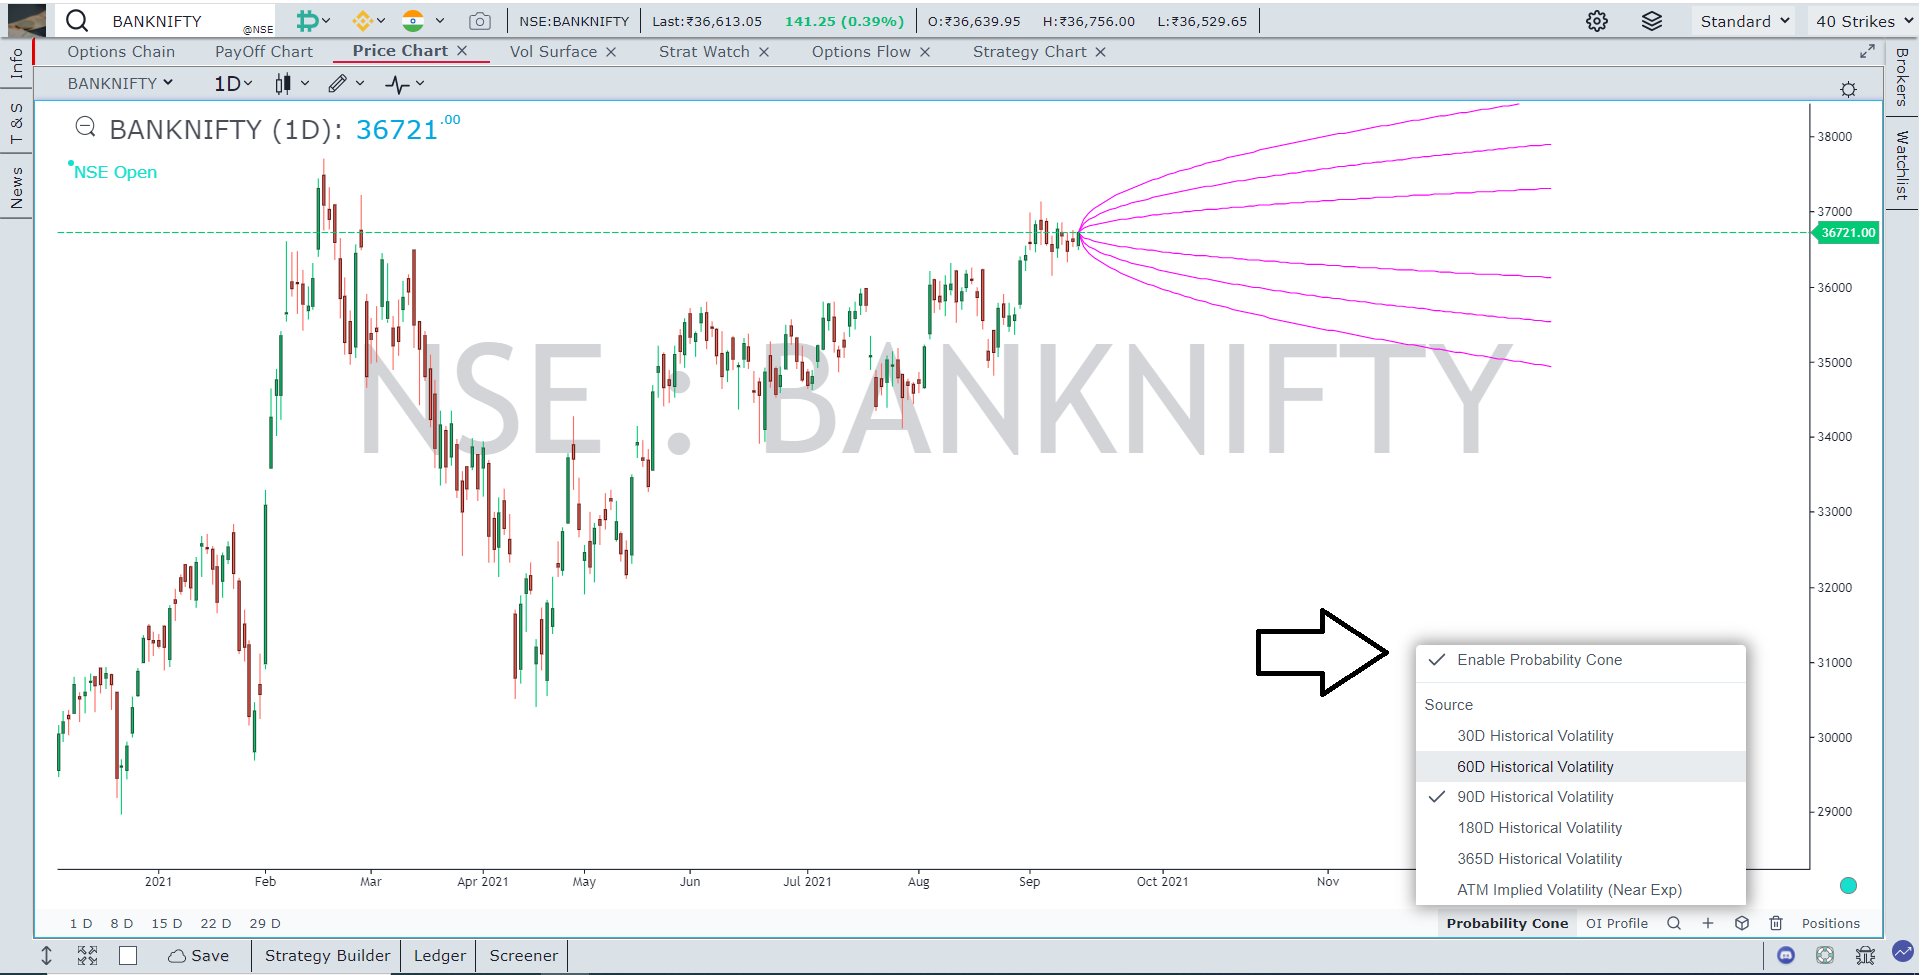
How to activate this tool?
First you have to go to Options Desk Price Chart Tab

Next searing for the Chart Bottom Bar. There is a OI Profile Menu in the Chart Bottom Bar

Criteria and Default Settings
This tool is activated only on 1DAY timeframe
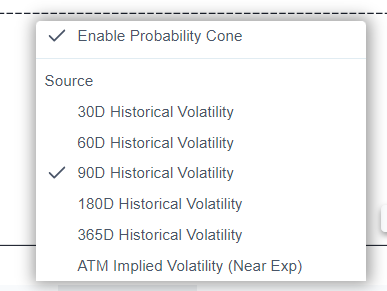
The default settings use 90Day period Historical Volatility calculated from the current price with the Probability’s set to One, Two, and Three Standard Deviations (68.2689%, 95.4499%, and 99.73%).You can change settings to use both Historical and Implied Volatility as basis
You can choose one of following as basis for calculation 1. ATM Implied Volatility 2. 30D, 60D, 90D, 180D and 365D Hisorical Volatility
An example perhaps
Any price in the future that occurs between the 1 Standard Deviation area of the Cone has a 68.2689% chance of occurring based on historical volatility. As the time range moves into the future the cones or area of potential price movement grow larger
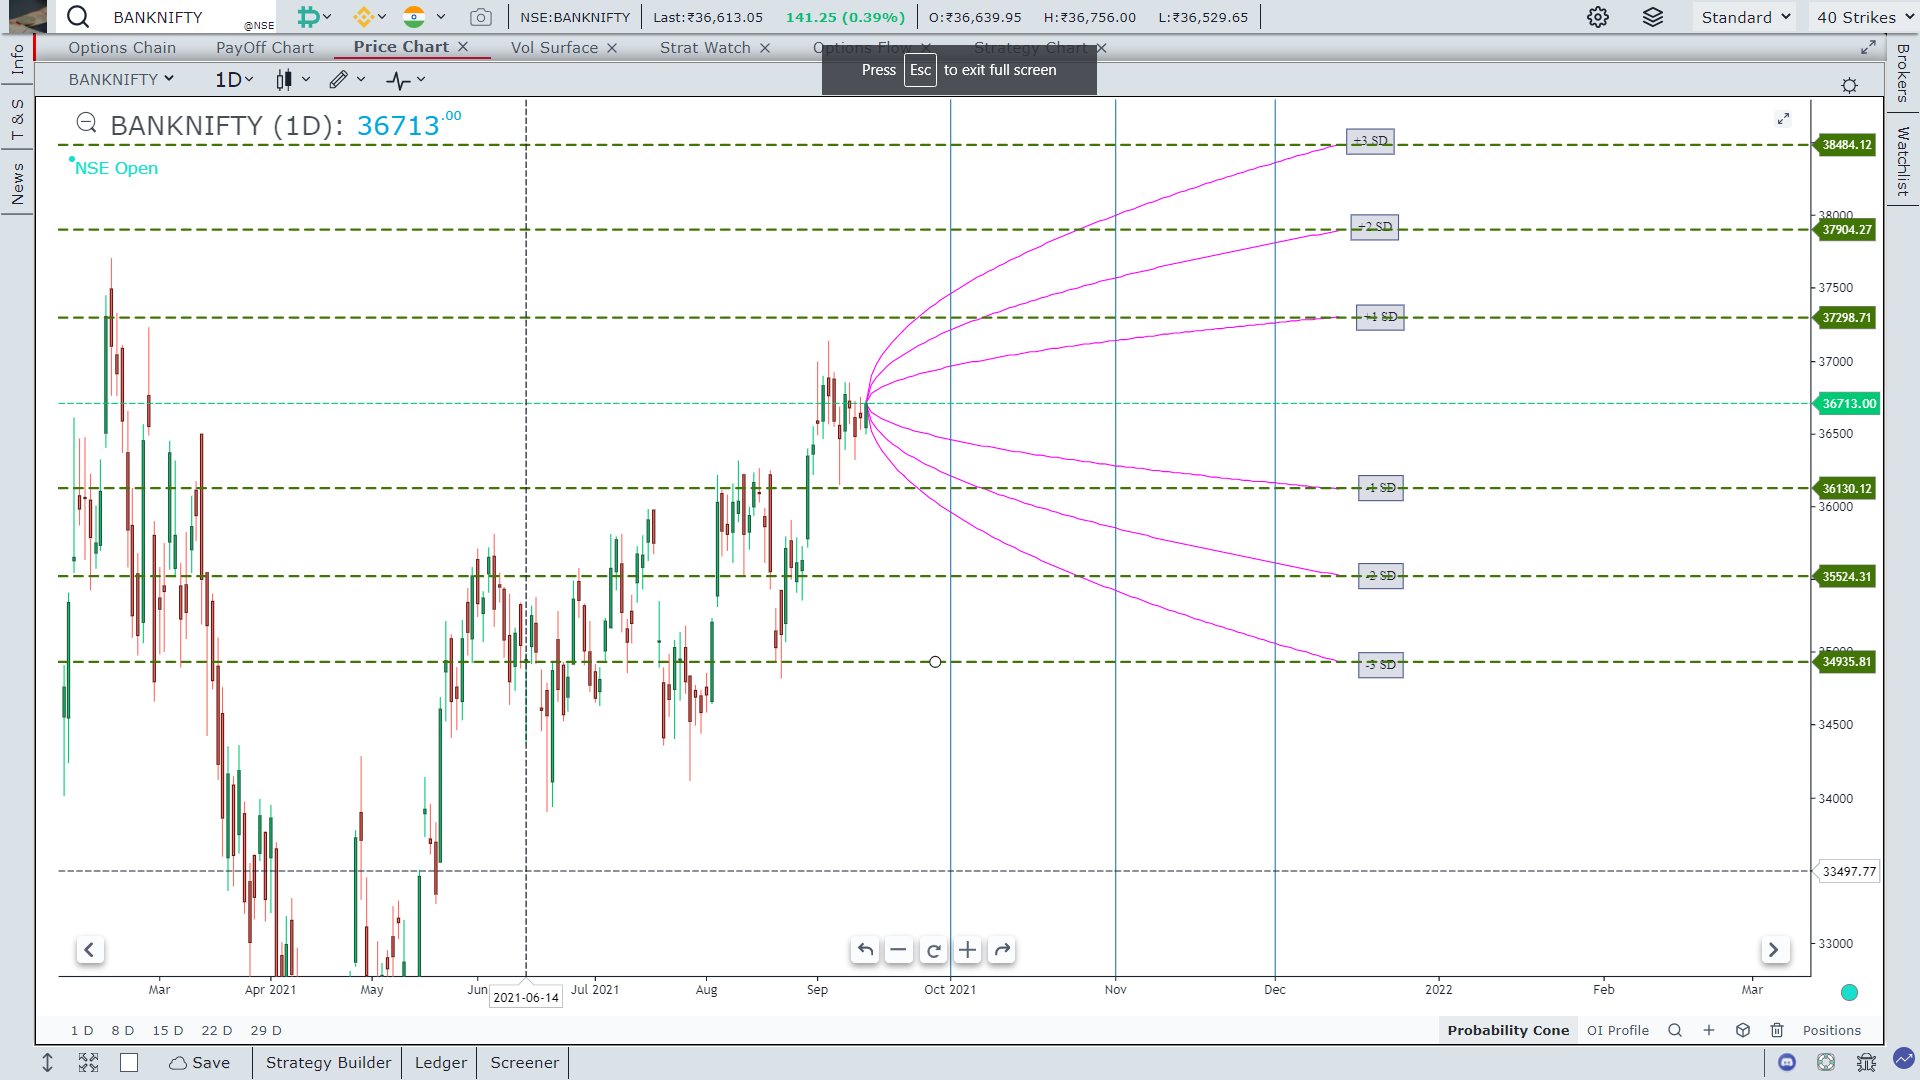
Extending through 3 months of expiry. The theory behind this is that a market has a much greater chance of trading at a price range INR 1,793 above or below the current price in 3 months than it does of only a INR 600 range based on the options pricing methods
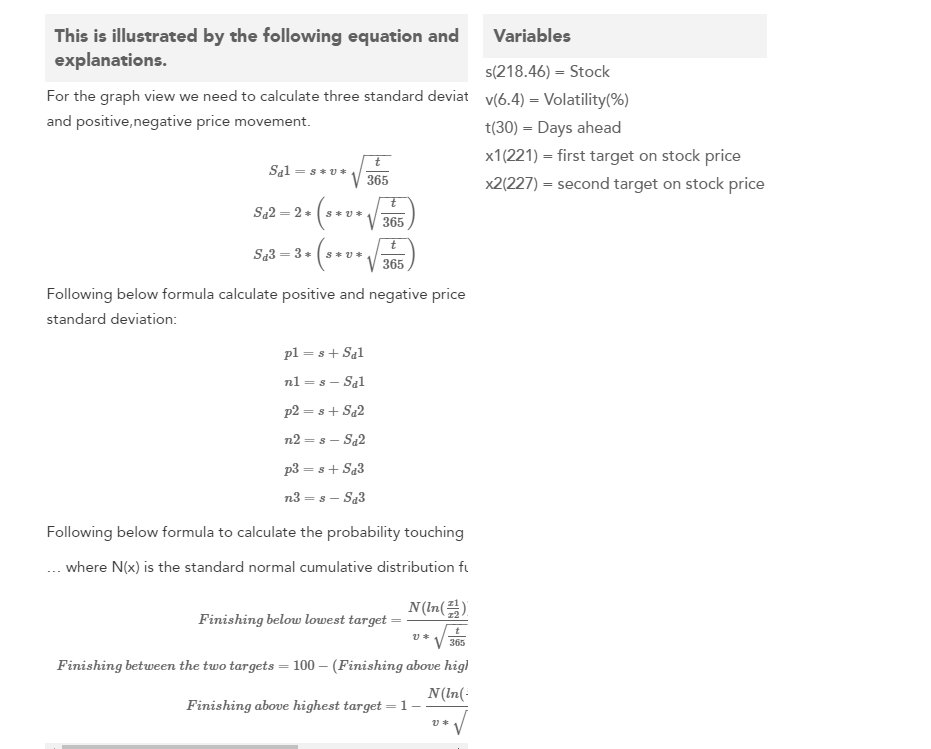
Finally, if you are the Geeky kind, some math for you
Use Case
The Options Probability Cone in GoCharting projects the statistically expected price range of the underlying asset based on current Implied Volatility, plotting the one and two standard deviation ranges over the option’s time to expiry. It is used to select strikes that are statistically outside the expected move.
Strategy
Use the Probability Cone to select options strikes that are outside the 1-standard-deviation cone for premium selling strategies (credit spreads, covered calls, cash-secured puts). Sell at strikes where the probability of expiring worthless is above 70% for high-probability income strategies.
Common Mistakes
Do not use the Probability Cone without understanding that it is based on Implied Volatility, which is itself a forecast and not guaranteed. Avoid selling premium in extremely high-IV environments where the cone is artificially wide due to temporary market stress. Do not ignore tail risk beyond the 2-sigma boundary; low-probability events do occur.