oi – Open Interest
The oi variable in Lipi Script is a built-in variable that represents the Open Interest for each bar on the chart.
Open Interest is a critical metric in derivatives trading that reflects the total number of outstanding contracts (futures or options) that are open and not yet settled.
🔹 Syntax
oi🔹 Returns Type: float
Returns the open interest value of the current bar.
🔹 Usage You can directly use the oi variable in any Lipi script to access and analyze open interest data.
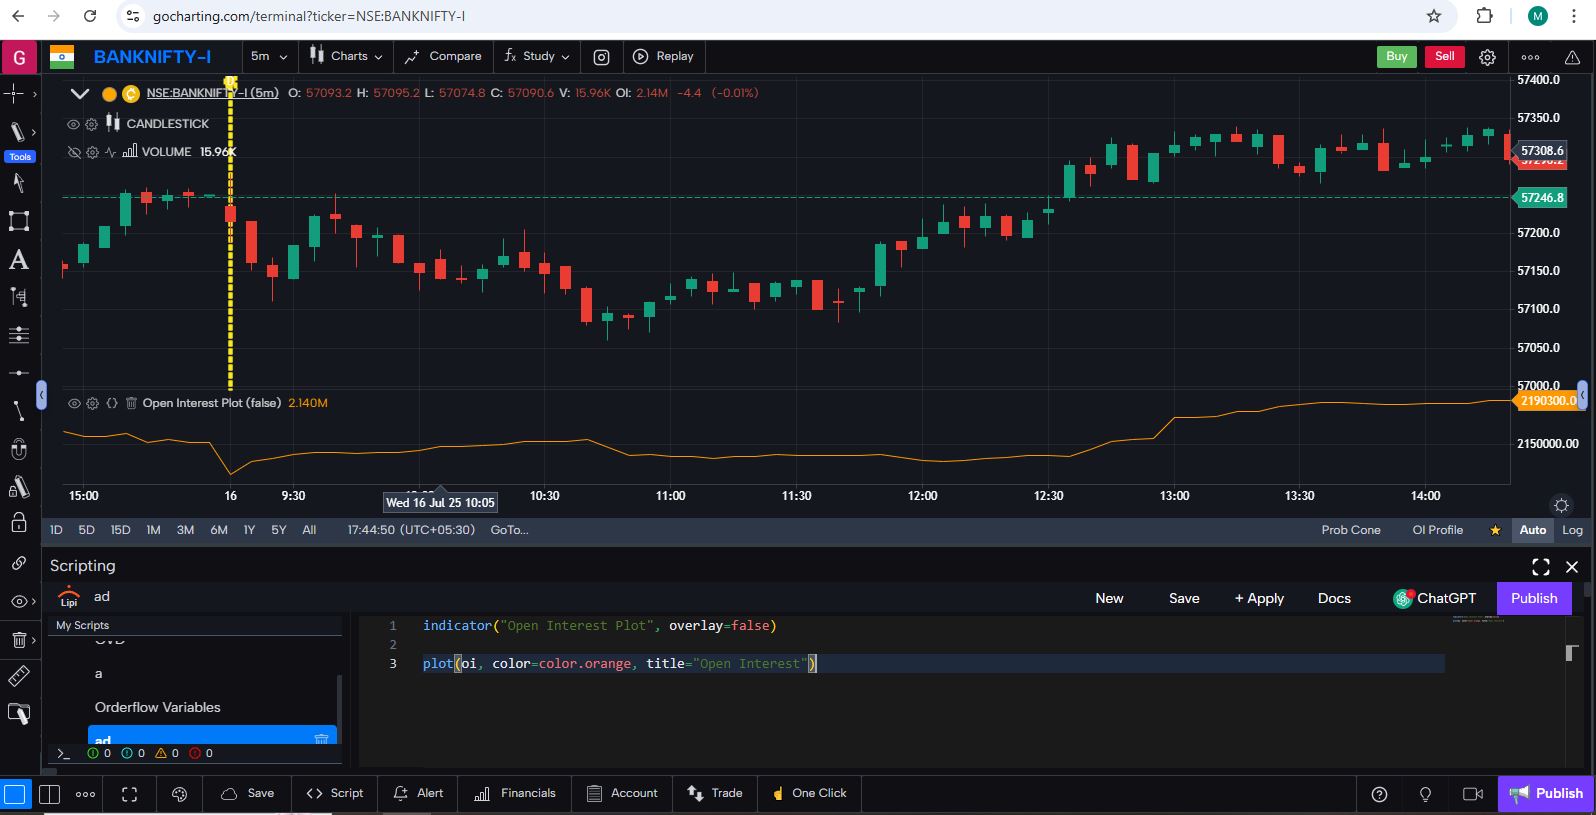
🔹 Example 1: Plot Open Interest
indicator("Open Interest Plot", overlay=false)

plot(oi, color=color.orange, title="Open Interest")
📌 This plots the open interest value for every bar as an orange line on a separate pane.
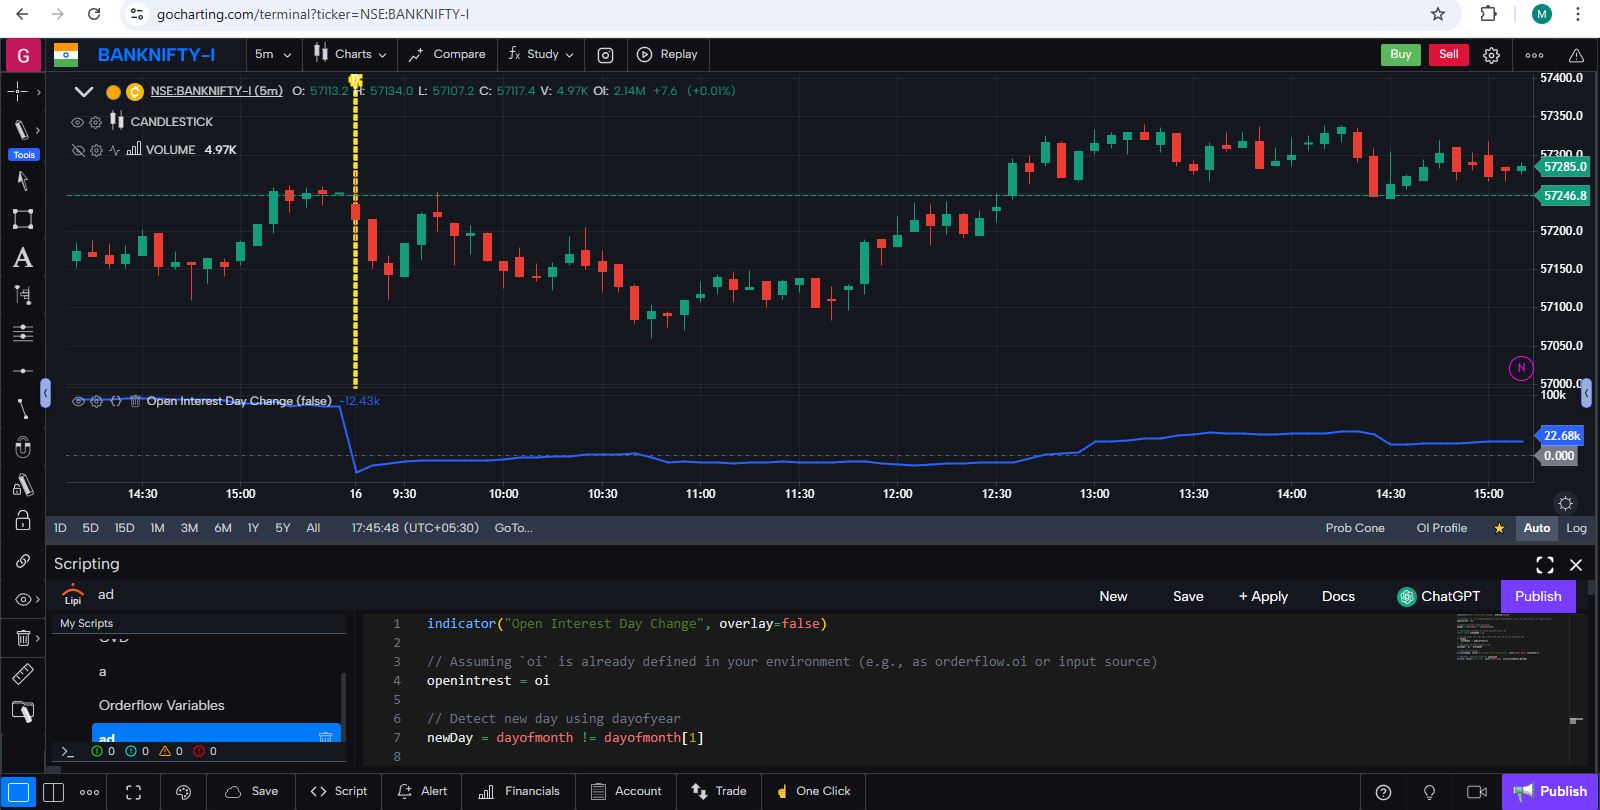
🔹 Example 2: Open Interest Change (Day-over-Day)
indicator("Open Interest Day Change", overlay=false)

// Assuming `oi` is already defined in your environment (e.g., as orderflow.oi or input source)
openintrest = oi

// Detect new day using dayofyear
newDay = dayofmonth != dayofmonth[1]

// Persistent variable to store previous day's OI
static float prevDayOI = na

// At the start of a new day, store the last OI of the previous day
if newDay {
    prevDayOI := openintrest[1]
}
// Calculate the day change in OI
oiChange = oi - prevDayOI

// Plot the OI change
plot(oiChange, title="OI Change from Previous Day", color=color.blue, linewidth=2)

// Optional: Add zero line for reference
hline(0, title="Zero Line", color=color.gray, style=hlineStyle.dotted)
📌 This plots the change in open interest from the previous day OI.
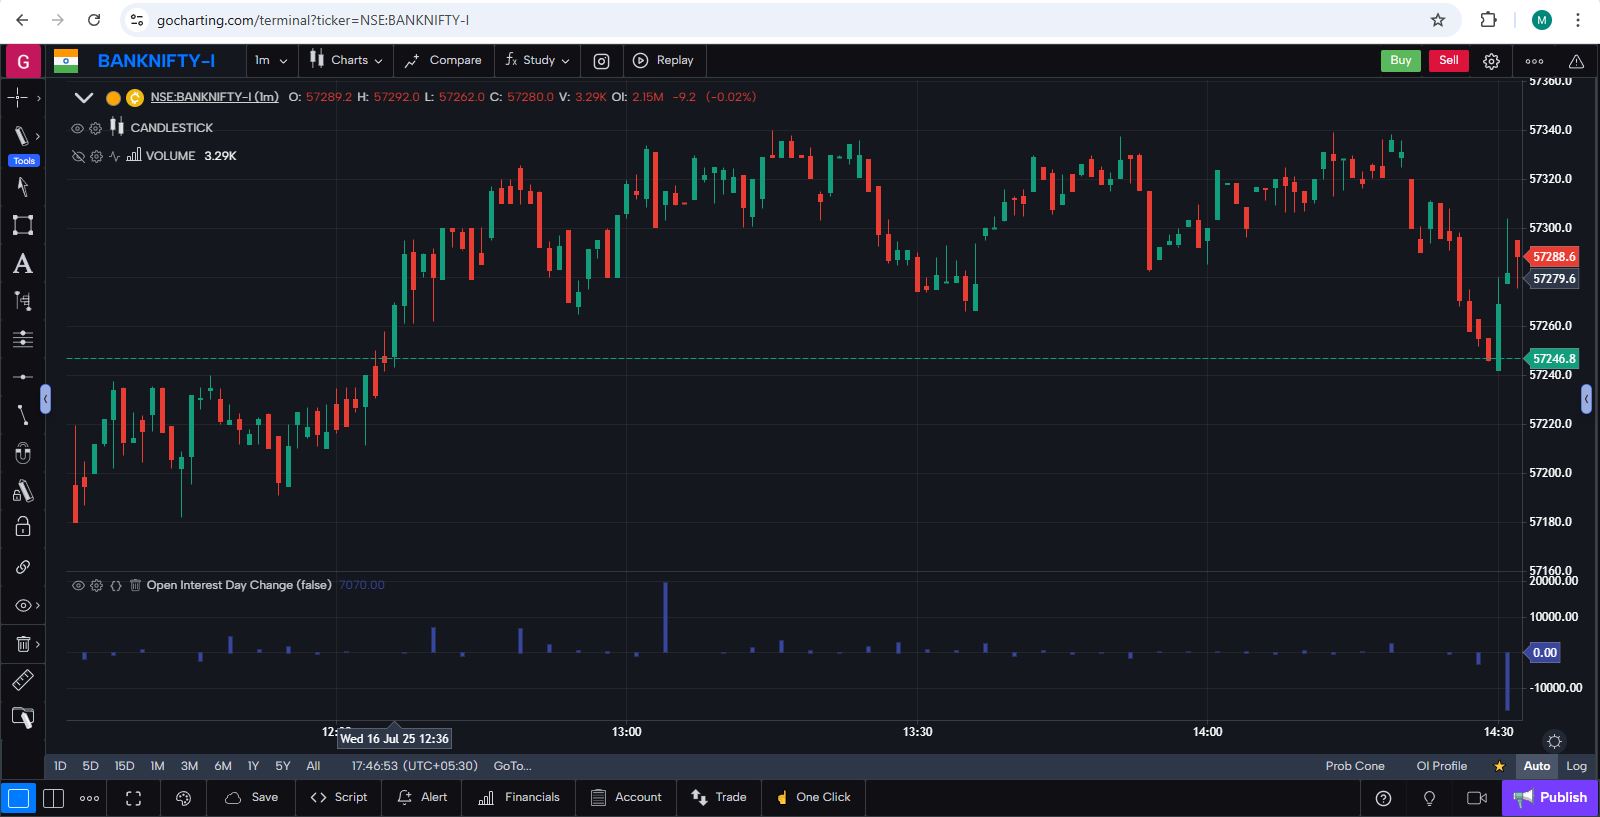
🔹 Example 3: Open Interest Change (bar-by-bar)
indicator("Open Interest Day Change", overlay=false)

openintrest = oi  - oi[1]
plot(openintrest,style=plotStyle.bar)
📌 This plots the change in open interest from the previous bar.
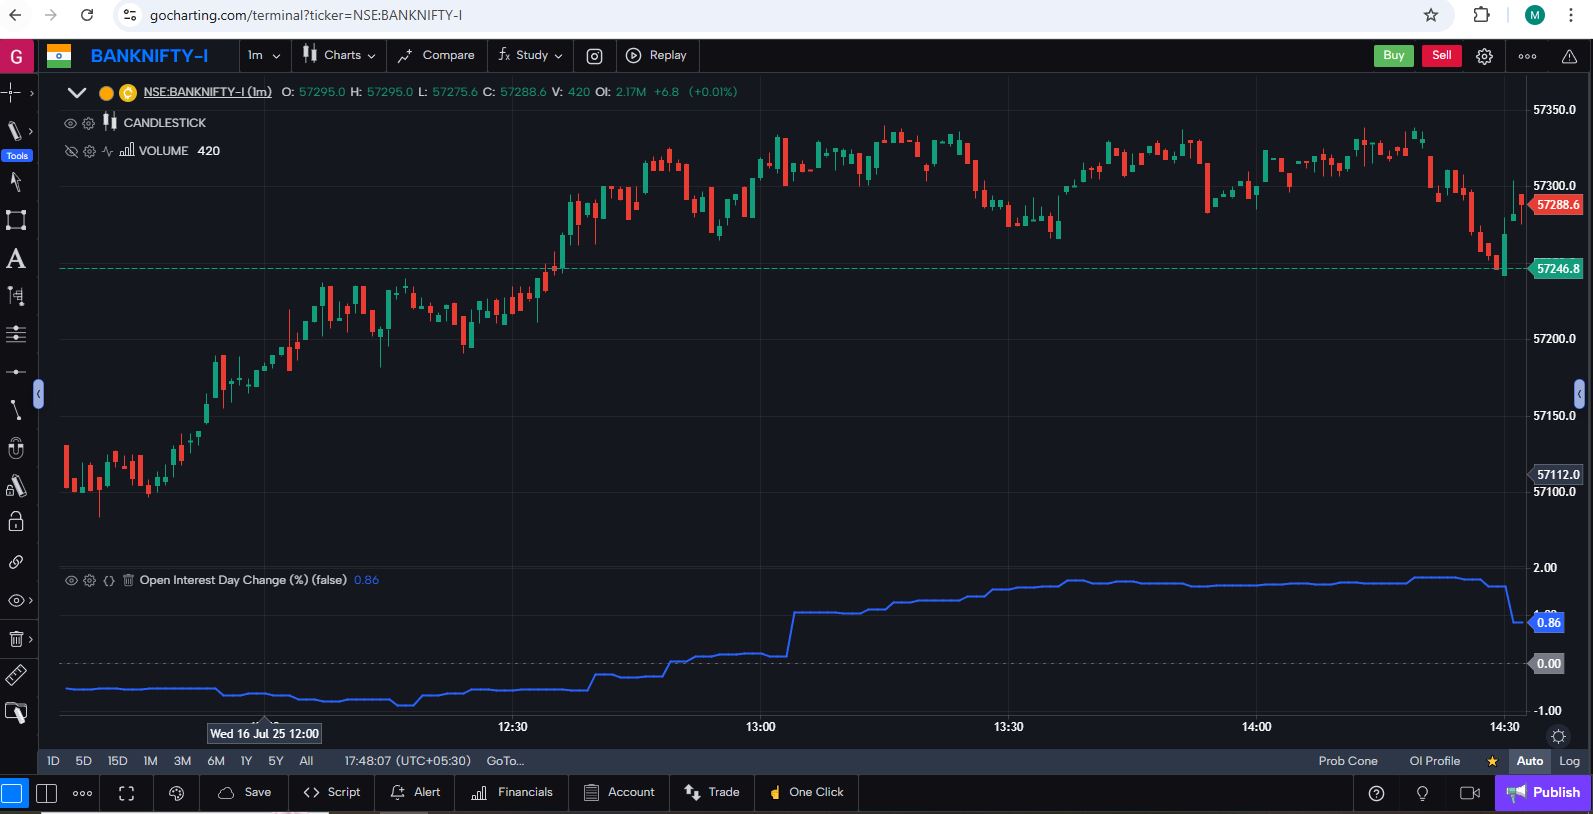
🔹 Example 4: Open Interest Day Change Percentage %
indicator("Open Interest Day Change (%)", overlay=false)

// Assuming `oi` is already defined in your environment
openintrest = oi

// Detect new day using dayofmonth
newDay = dayofmonth != dayofmonth[1]

// Persistent variable to store previous day's OI
static float prevDayOI = na

// At the start of a new day, store the last OI of the previous day
if newDay {
    prevDayOI := openintrest[1]
}
// Calculate OI day change percentage (avoid divide-by-zero)
oiChangePercent = (prevDayOI != 0) ? ((openintrest - prevDayOI) / prevDayOI) * 100 : na

// Plot the OI percentage change
plot(oiChangePercent, title="OI Change (%) from Previous Day", color=color.blue, linewidth=2)

// Zero line for reference
hline(0, title="Zero Line", color=color.gray, style=hlineStyle.dotted)
📌 This plots the change in open interest percentage from the previous day OI.