The Arrow Marker Drawing Tool
The Arrow Marker Drawing Tool is a versatile feature that allows you to pinpoint and highlight specific points on your chart with clear, directional markers. It is useful for drawing attention to specific candlesticks, trends, breakout points, or any significant data points on your charts.
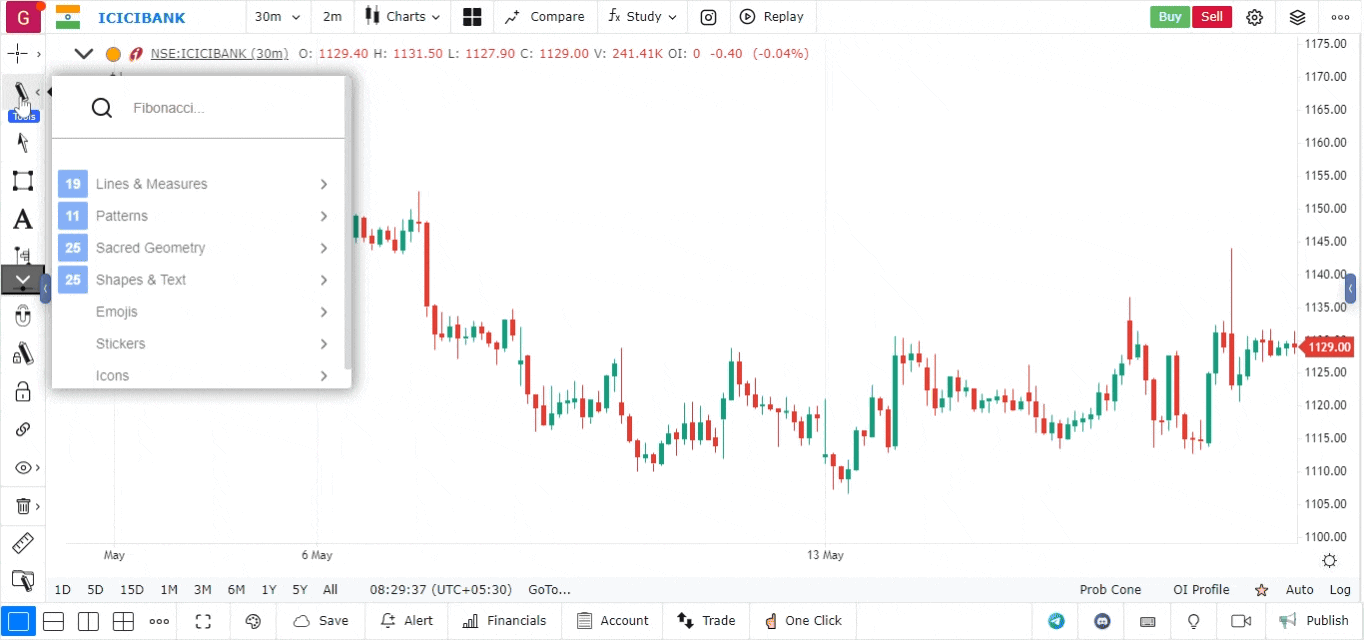
How to Use the Arrow Marker Drawing Tool
-
Open the Chart:
- Log into your account.
- Open the chart of the asset or financial instrument that you wish to analyze.
-
Access the Drawing Tools Menu:
- Find the drawing tools menu, which is usually located on the left side or top of the platform interface.
- Click on the drawing tools icon to open a dropdown list of available tools.
-
Select the Arrow Marker Tool:
- From the list of tools, select the Arrow Marker tool. It is typically represented by an arrow icon.
- This tool is designed to create directional markers that point to specific spots on the chart.
-
Draw the Arrow Marker:
- Click on the chart where you want to place the arrow marker.
- Drag your mouse in the direction you want the arrow to point.
- Release the mouse button to set the arrow marker in place.
-
Customize the Arrow Marker (Optional):
- Right-click on the arrow marker to access customization options.
- You can change the color, size, line thickness, and style of the arrow marker to match your chart preferences.
- Adjustments make your chart more visually appealing and easier to interpret.
-
Move or Edit the Arrow Marker:
- If you need to reposition or modify the arrow marker, click on it and drag it to the new location.
- You can also resize or adjust the angle of the arrow by clicking on its endpoints and dragging them.
- To remove the arrow marker, right-click on it and select the delete or remove option.
Use Case
The Arrow Marker tool places a directional arrow on the chart to mark key moments such as trade entries, exits, significant news events, or pattern confirmation signals. It is used to annotate charts for review and communication.
Strategy
Use Arrow Markers to annotate your post-trade reviews: place a green up arrow at every entry point and a red down arrow at every exit point. This visual record helps identify patterns in your decision-making across multiple trades and timeframes.
Common Mistakes
Do not over-annotate your charts with too many arrow markers, as this creates visual clutter that obscures price action. Avoid using arrow markers as a substitute for a proper trade journal. Do not forget to remove or organise old annotations when analysing current market conditions.