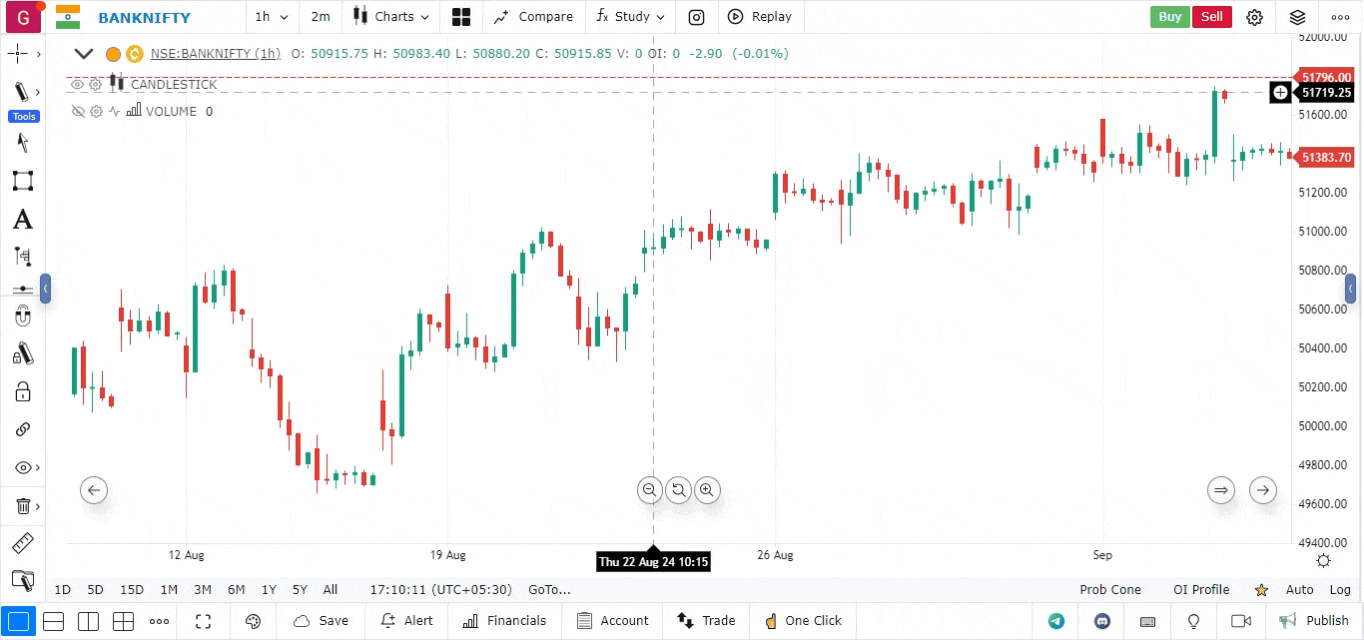
Trend Intensity Indicator
The Trend Intensity Indicator is a technical analysis tool that measures the strength and direction of a trend in the market. It quantifies how strongly a price is moving in a particular direction, helping traders identify potential trend reversals or continuations. This indicator can be particularly useful in volatile markets where trends can change rapidly.
Key Features of the Trend Intensity Indicator:
- Trend Strength Measurement: Assesses the intensity of a current trend, providing insights into potential future price movements.
- Signal Generation: Offers signals for potential entries and exits based on the strength of the trend.
- Versatile Application: Can be used across various asset classes, including stocks, forex, and commodities.
Calculation of the Trend Intensity Indicator
The Trend Intensity Indicator is typically calculated using price data over a specified period. The exact formula may vary by platform, but a common approach includes:
- Calculate the Average Price Change:
Where is the number of periods considered.
- Calculate the Trend Intensity:
This calculation gives a value between 0 and 100, where values closer to 100 indicate strong upward momentum, and values closer to 0 indicate strong downward momentum.
Using the Trend Intensity Indicator
To effectively analyze the Trend Intensity Indicator on your charting platform, follow these steps:
-
Load the Chart for the Asset:
- Open the charting platform.
- Load the chart for the specific asset you wish to analyze.
-
Set the Timeframe:
- Choose an appropriate timeframe for your analysis (e.g., daily, weekly). The Trend Intensity Indicator can be applied to various timeframes.
-
Add the Trend Intensity Indicator:
- Navigate to the Indicators section.
- Search for “Trend Intensity” in the list of available indicators.
- Click on the Trend Intensity Indicator to add it to your chart. It will appear in a separate panel below the main price chart.
-
Interpret Signals:
- Strength Levels:
- Values above 70 typically indicate a strong upward trend.
- Values below 30 indicate a strong downward trend.
- Crossovers:
- A crossover above the 50 line may suggest a potential bullish trend.
- A crossover below the 50 line may indicate a potential bearish trend.
- Divergence: Look for divergences between the Trend Intensity Indicator and price action. For example, if prices are making new highs but the Trend Intensity is declining, it may signal a weakening trend.
- Strength Levels:
Use Case
The Trend Index measures the consistency of price direction over a lookback period, scoring it on a scale of strength. High readings indicate a consistent, reliable trend; low readings indicate choppy, inconsistent price movement.
Strategy
Only take trend-following trades when the Trend Index is above 50 (or your calibrated threshold). Filter out all mean-reversion trades when the Trend Index is high. When the Trend Index is low, switch to range-trading or breakout-entry strategies.
Common Mistakes
Do not use the Trend Index in isolation for trade entries. Avoid applying the same threshold to all markets. Do not ignore that trend strength can be high in both up and down trends — combine with directional indicators.