Open Interest Sense (OI Sense)
Open Interest Sense is an indicator in GoCharting created to allow intraday traders to gauge the direction of the market in realtime mode
It uses a combination of price, volume and open interest data to plot a band of colors as shown below

OI Sense Color Bands
These colors bands are as follows
- Short Covering (Orange)
- Long Unwinding (Cyan)
- Short Build Up (Red)
- Long Build Up (green)
How are these Color Bands created
As shown in the chapter on Open Interest, we know the below logic holds true in the market
Open Interest Matrix
Building on this logic, we have created an extension of it which takes the Price movement % change over the course of the day along with OI % change over the course of same period to create the below rules
- Short Covering: Price change > 0 & Open Interst Change % < 0
- Long Unwinding: Price change < 0 & Open Interst Change % < 0
- Short Build Up: Price change < 0 & Open Interst Change % > 0
- Long Build Up: Price change > 0 & Open Interst Change % > 0
Below is an example of its use case. We see Gap down opening and showing early signs of Short Buildup on OI Sense
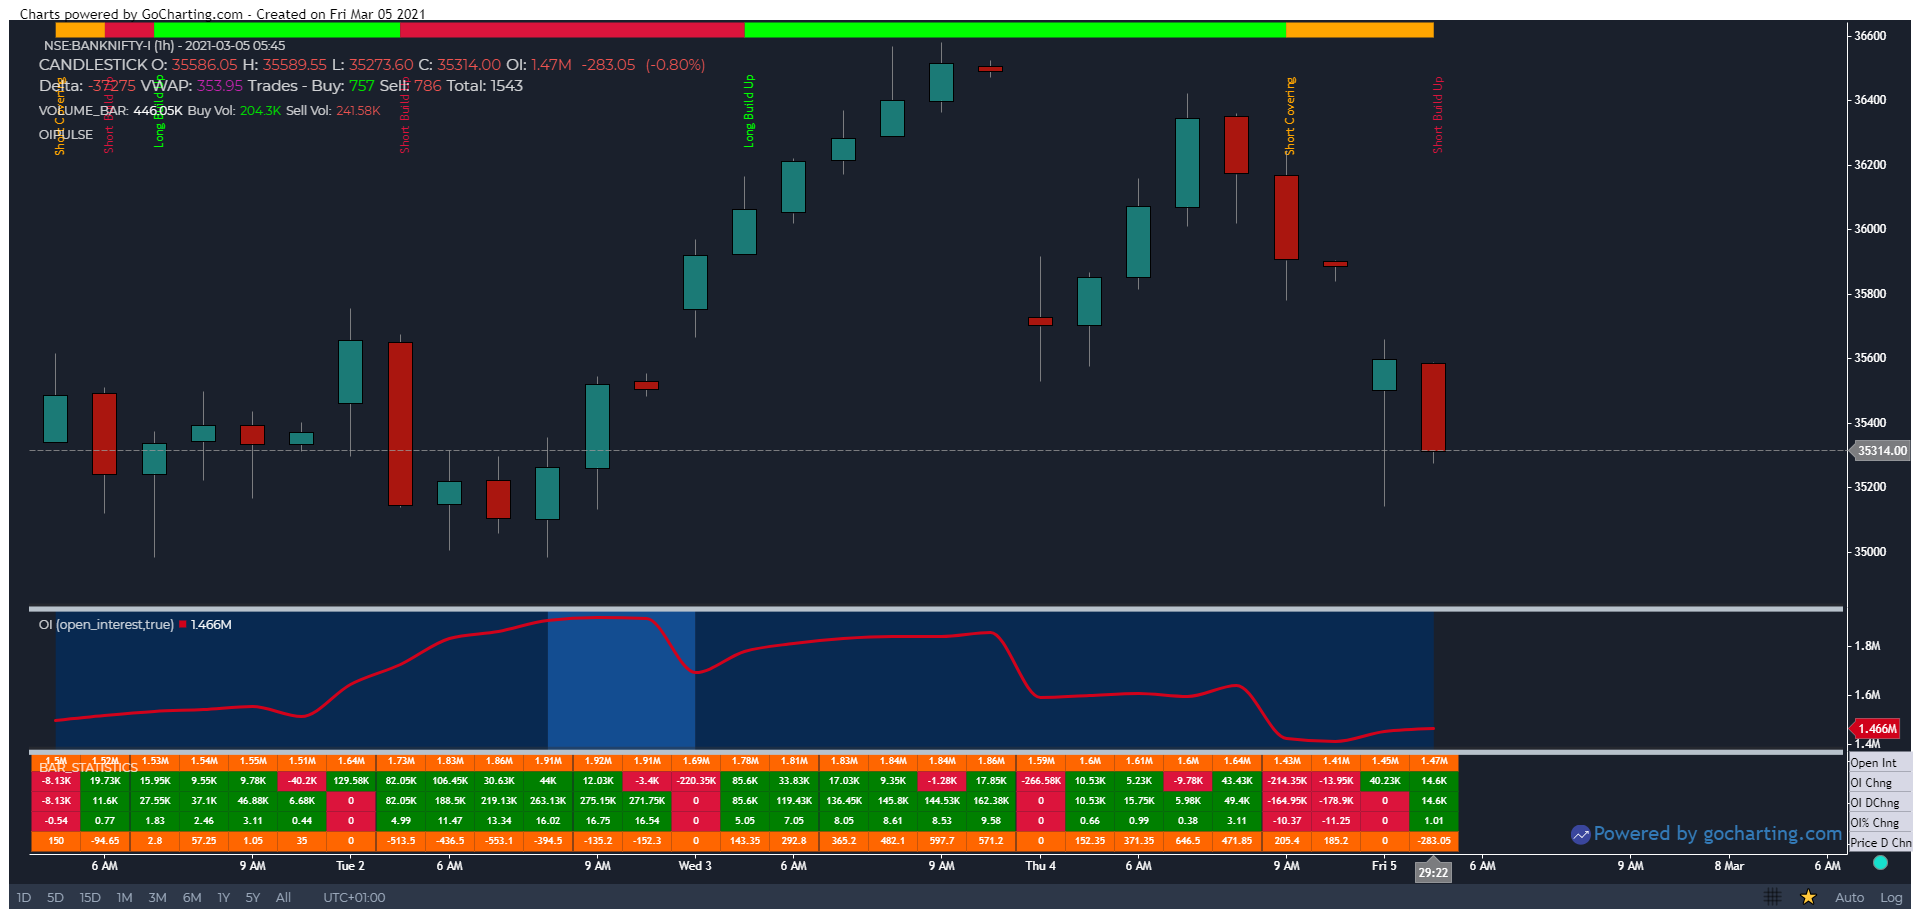
Use Case
OI Sense analyses changes in open interest relative to price changes to determine whether current OI is being built by longs or shorts. Rising OI with rising price indicates new longs are entering; rising OI with falling price indicates new shorts are entering.
Strategy
Use OI Sense to confirm trend breakouts: when price breaks above resistance and OI Sense shows new long buildup (OI rising with price), the breakout has institutional conviction — enter on the breakout with confidence. When OI rises but price falls, the market is building short positions — use as a bearish confirmation signal.
Common Mistakes
Do not use OI Sense on instruments with very low options liquidity. Avoid reacting to every OI Sense reading; focus on significant changes relative to the recent average. Do not confuse rising OI with bullish signals — direction of OI change must be interpreted relative to price movement.