← All Scripts
Aggression Ration Analysis

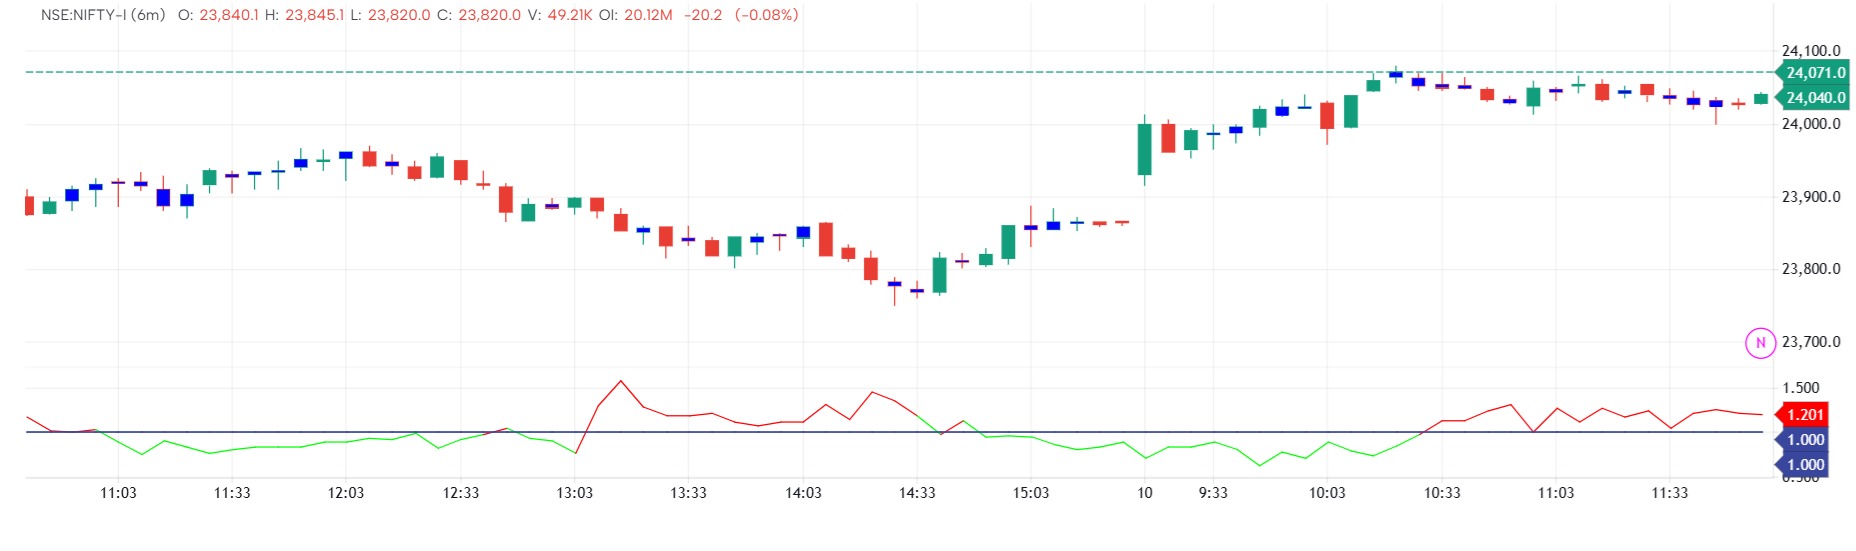
📊 Aggression Ratio – What it shows
This indicator measures market pressure by comparing selling volume vs buying volume:
- Ratio = Sell Volume / Buy Volume
It reflects who is more aggressive in the market at any moment.
🔍 Interpretation
- Ratio > 1.0 (Red)
→ Selling pressure dominates
→ More aggressive sellers (potential bearish sentiment) - Ratio < 1.0 (Green)
→ Buying pressure dominates
→ More aggressive buyers (potential bullish sentiment) - Ratio ≈ 1.0
→ Balanced market (buyers ≈ sellers)
⚙️ Smoothing Logic
Uses either:- EMA (default) → faster, reacts quickly to changes
- SMA → smoother, slower response
Smoothing helps reduce noise from raw order flow spikes.
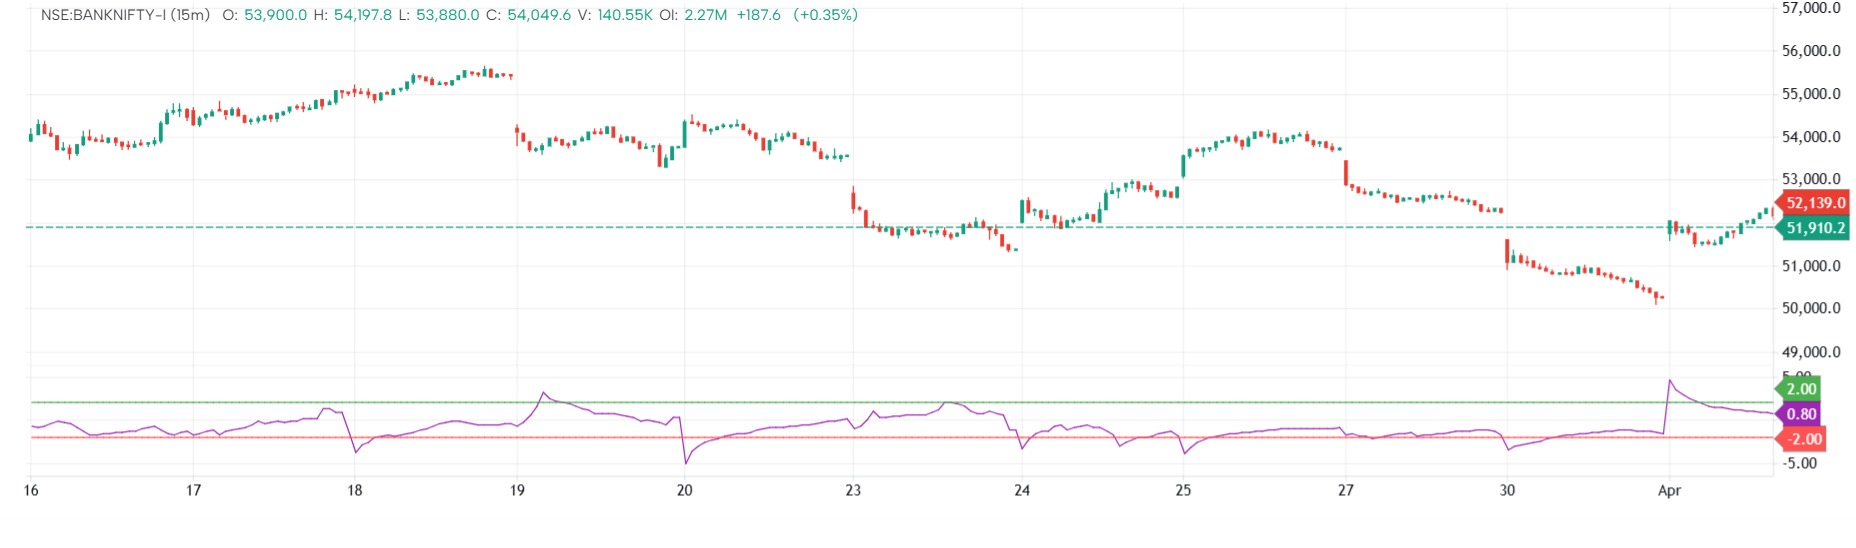
📈 Visualization
- Column mode (default):
Easy visual of shifting dominance between buyers and sellers. - Optional ratio line:
Helps track trend in aggression over time. - Baseline at 1.0:
Critical threshold separating bullish vs bearish pressure.
🧠 Practical Insight
- Sustained >1 → Strong selling trend / possible continuation down
- Sustained <1 → Strong buying trend / possible continuation up
- Sharp spikes → Potential exhaustion or reversal zones
- Divergence vs price → Early signal of weakening trend
⚠️ Important Note
Disclaimer
The information and publications are not meant to be, and do not constitute, financial, investment, trading, or other types of advice or recommendations supplied or endorsed by GoCharting. Read more in the Terms of Use.
Related Scripts
Comments (1)
Loading comments…