← All Scripts
Chop Zone Histogram Nitin 5M

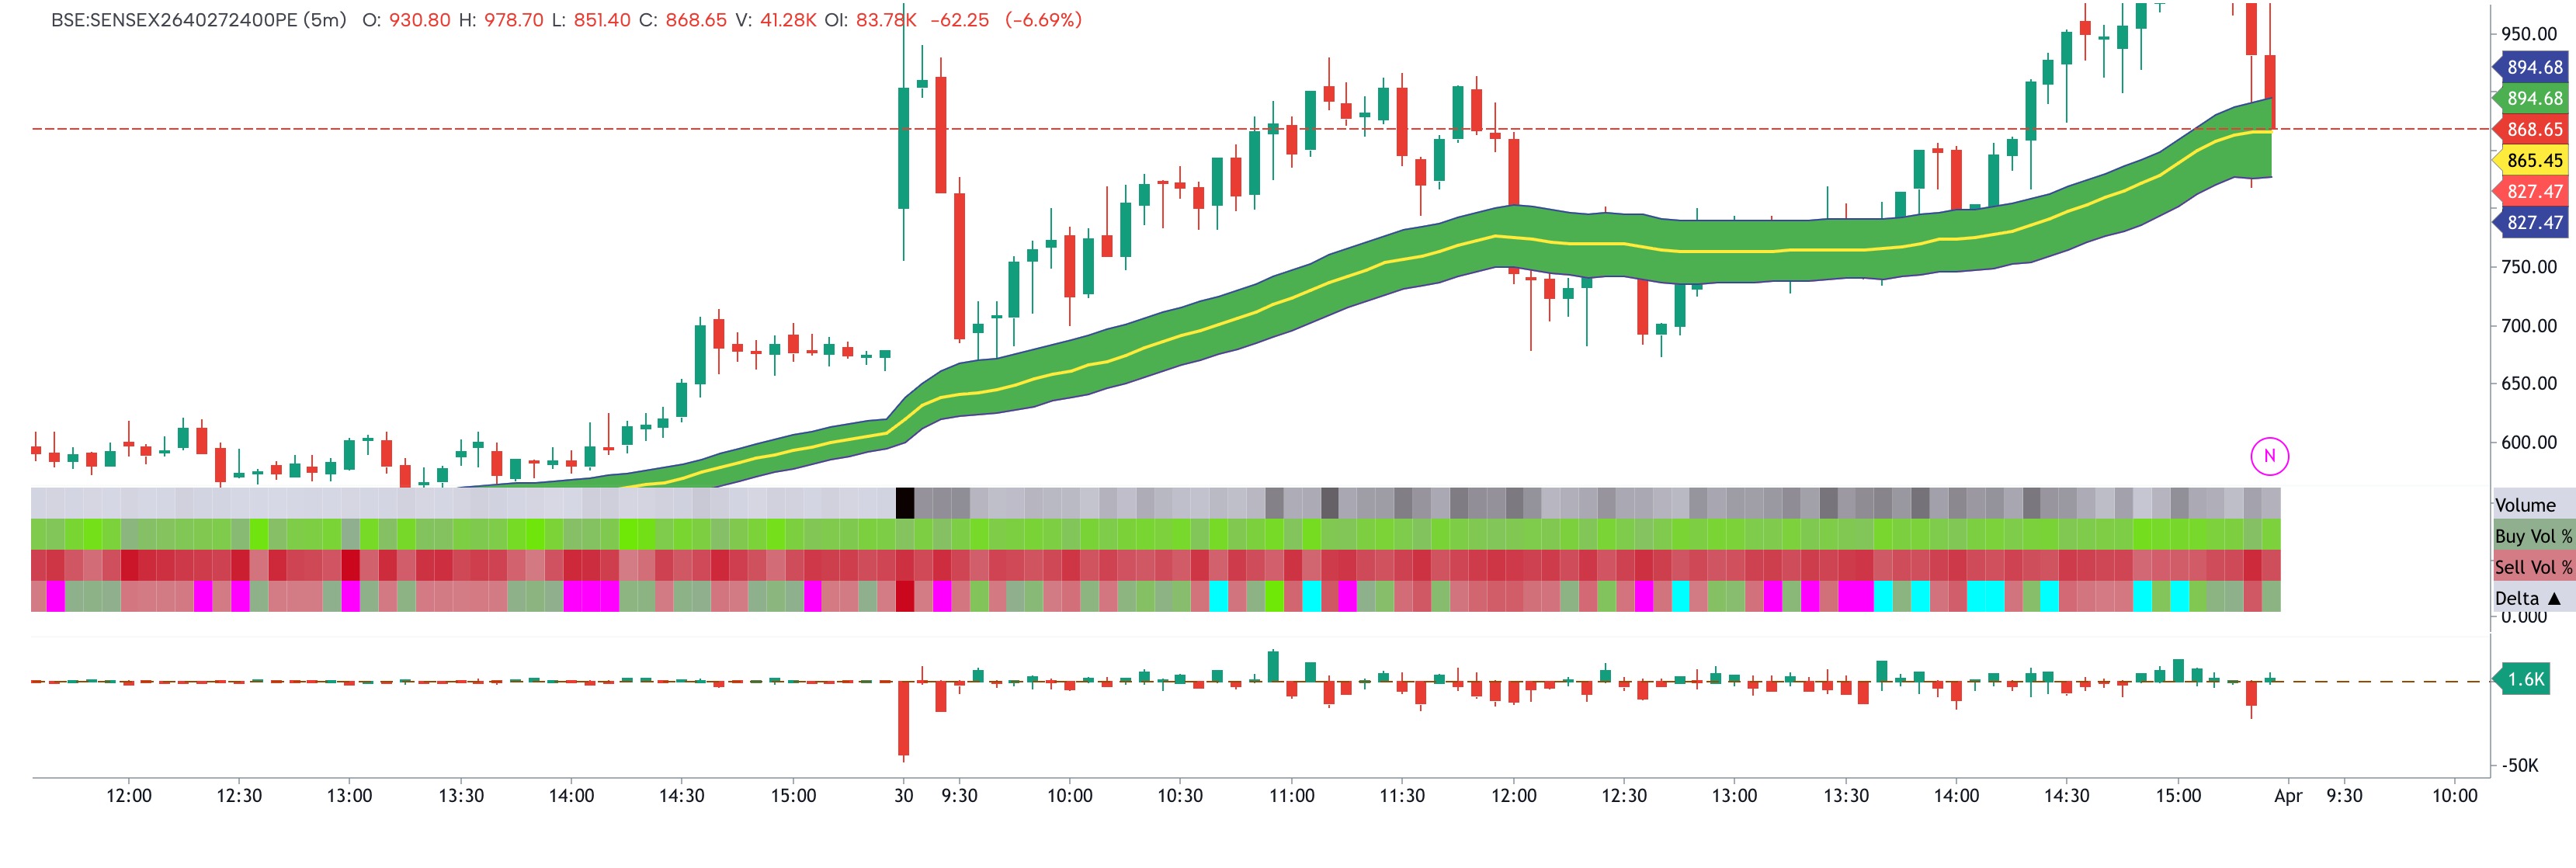
This script is a custom version of the “Chop Zone” indicator.
It measures the angle/slope of the 34 EMA and colors a histogram based on trend strength and direction.
The idea is:
Strong upward EMA slope → bullish colors
Strong downward EMA slope → bearish colors
Flat EMA slope → yellow (choppy/ranging market)
Disclaimer
The information and publications are not meant to be, and do not constitute, financial, investment, trading, or other types of advice or recommendations supplied or endorsed by GoCharting. Read more in the Terms of Use.
Related Scripts
Comments (0)
Loading comments…