← All Scripts
Triple EMA with Upward Cross

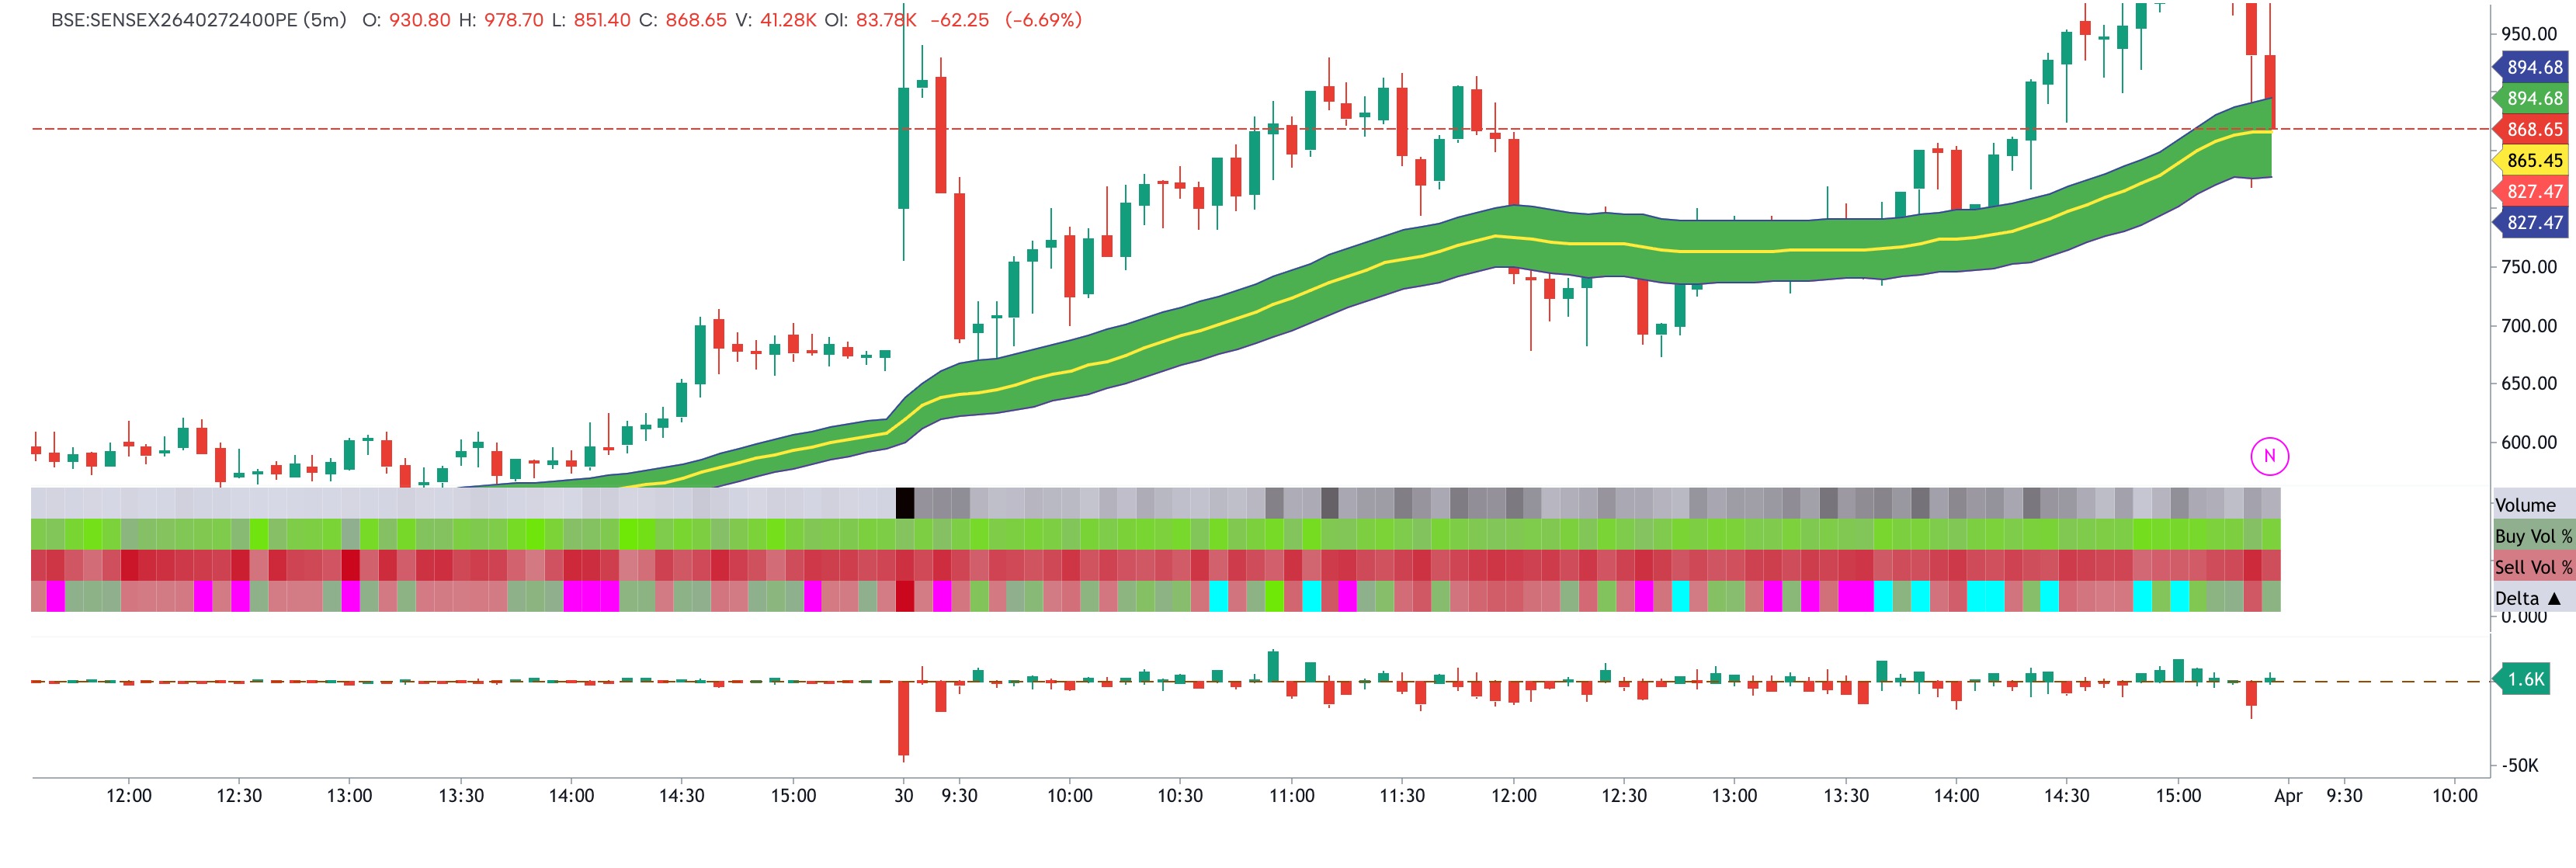
plots three 50-period Exponential Moving Averages on the chart
each calculated from a different price source:
- EMA Close (yellow, thicker) — the standard EMA based on closing prices
- EMA Low (red, thin) — EMA calculated from candle lows, acting as a dynamic support floor
- EMA High (green, thin) — EMA calculated from candle highs, acting as a dynamic resistance ceiling
Disclaimer
The information and publications are not meant to be, and do not constitute, financial, investment, trading, or other types of advice or recommendations supplied or endorsed by GoCharting. Read more in the Terms of Use.
Related Scripts
Comments (0)
Loading comments…