OF Part A: Institutional + Unwind + Absorption

This script's source code is protected by the author.
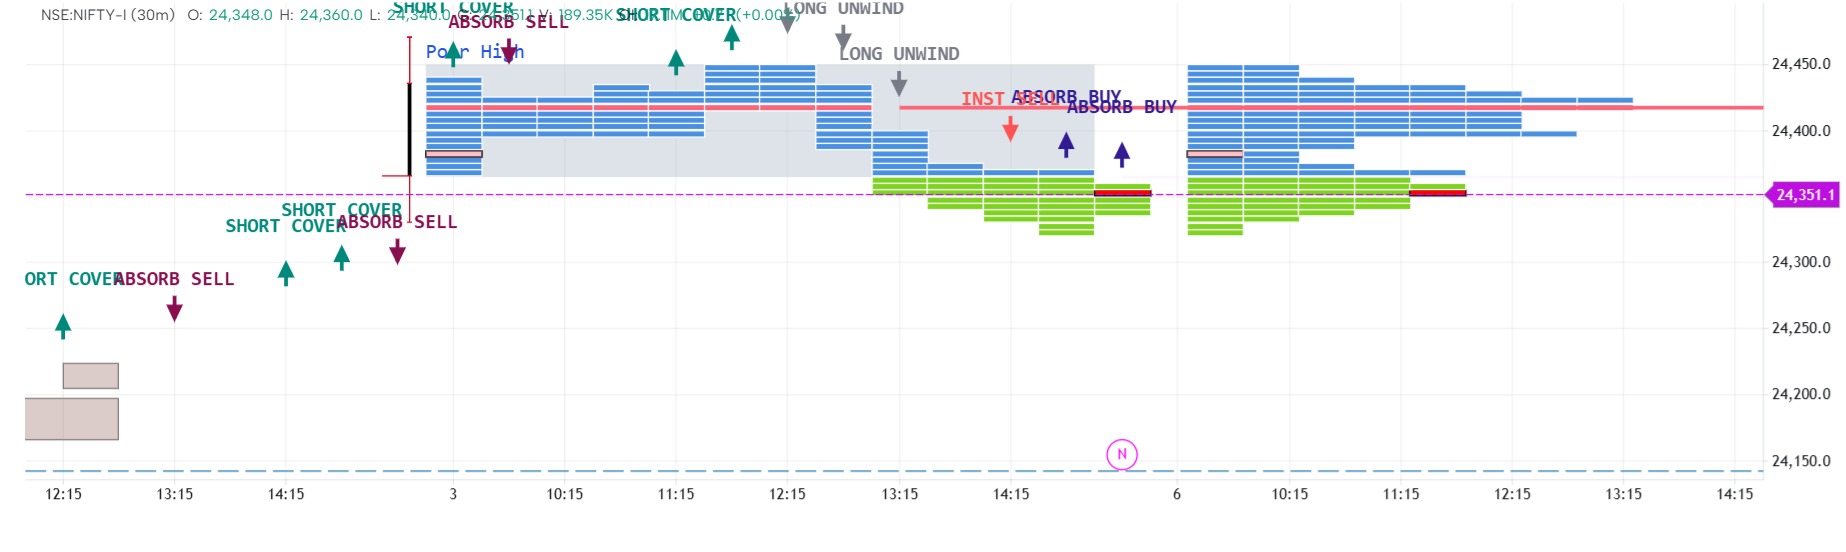
identifies 6 high-probability institutional order flow setups in real time using Delta, Open Interest, and Volume Imbalance. Designed for Footprint/Cluster charts on any index or futures instrument.
## What This Indicator Does
This indicator reads raw order flow data — Delta, Buy/Sell Volume, and Open Interest — to classify institutional activity into 6 clearly labelled signals directly on your candles. No lagging moving averages. No price-derived indicators. Pure order flow logic.
It is Part A of a two-part institutional flow suite. Part B covers Exhaustion, Delta Divergence, and Delta Flips.
## The 6 Signals
### 🟢 INST BUY — Institutional Buying
**Color: Green arrow below bar**
Strong positive delta (aggressive buying) + price closes up + Open Interest is rising. Rising OI confirms fresh long positions are entering — this is not short covering or noise, it is new institutional money going long.
**Best use:** Look for this at key support levels, VWAP reclaims, or after a consolidation. When OI rises with positive delta and a green close, smart money is accumulating.
### 🔴 INST SELL — Institutional Selling
**Color: Red arrow above bar**
Strong negative delta (aggressive selling) + price closes down + Open Interest is rising. Rising OI with negative delta confirms fresh short positions entering — institutions are initiating short positions, not just exiting longs.
**Best use:** Look for this at resistance zones, failed breakouts, or distribution areas. The combination of OI rising and negative delta is one of the most reliable bearish footprints.
### 🩵 SHORT COVER — Short Covering
**Color: Teal arrow below bar**
Price closes up + positive delta + Open Interest is falling. OI falling means existing positions are being closed. Combined with positive delta and an up close, this signals shorts buying back to exit — not new longs entering.
**Best use:** Short covering often creates sharp but unsustainable rallies. Use it as a warning that an up move may be a relief rally rather than genuine bullish momentum. Do not chase these moves blindly.
### ⚫ LONG UNWIND — Long Unwinding
**Color: Gray arrow above bar**
Price closes down + negative delta + Open Interest is falling. OI falling with selling pressure means longs are exiting their positions — not new shorts entering. This often happens at the end of a trend.
**Best use:** Long unwinding near highs or after an extended rally is an early warning of trend exhaustion. When longs exit and OI drops, the fuel driving the rally is being removed.
### 🔵 ABSORB BUY — Bull Absorption
**Color: Navy blue arrow below bar**
Sell volume dominates (bearish imbalance) but price still closes up or flat, with a visible rejection wick. Sellers are aggressively attacking but passive buyers at limit orders are absorbing every sell — price cannot fall.
**Logic:** SellVolume > BuyVolume × 1.3 AND close ≥ open AND bar has a significant wick (body < 50% of range).
**Best use:** Look for this at support levels or value areas. When sellers dominate volume but price refuses to drop, it signals a strong buyer defending a level. This is the core concept from Trader Dale's absorption methodology.
### 🟤 ABSORB SELL — Bear Absorption
**Color: Maroon arrow above bar**
Buy volume dominates (bullish imbalance) but price still closes down or flat, with a visible rejection wick. Buyers are aggressively attacking but passive sellers at limit orders are absorbing every buy — price cannot rise.
**Logic:** BuyVolume > SellVolume × 1.3 AND close ≤ open AND bar has a significant wick.
*Best use:** Look for this at resistance levels, prior highs, or supply zones. When buyers dominate volume but price refuses to rise, it signals a strong seller defending a level. High-probability reversal signal.
## Inputs / Settings
| Parameter | Default | Description |
|---|---|---|
| Delta Threshold | 40,000 | Minimum delta for INST BUY/SELL signals. Adjust based on instrument — Nifty Futures 30m typically sees deltas of 50K–300K. Lower to 5,000–10,000 for 5m charts or lower-volume instruments. |
| Bid/Ask Imbalance Ratio | 1.3 | Minimum ratio of sell-to-buy (or buy-to-sell) volume for Absorption signals. 1.3 = 30% more aggressive volume on one side. Raise to 1.5–2.0 to filter only extreme imbalances. |
| OI Lookback bars | 1 | How many bars back to compare OI for rising/falling detection. Default 1 = previous bar. Increase to 3–5 for smoother OI trend detection on noisy data. |
## How to Use
**Chart Type:** Footprint / Cluster chart (required for delta and volume split data)
**Recommended Timeframes:** 5m, 15m, 30m on Nifty Futures, Bank Nifty, Crude Oil, or any high-liquidity futures instrument
**Alert Setup:**
1. Apply the indicator to your chart
2. Click **Alert** → select **"OF Part A: Institutional + Unwind + Absorption"**
3. Set condition to **"Any alert() function call"**
4. Choose notification method (Push / Email / Webhook)
5. One alert catches all 6 signal types with full details in the alert message
## Signal Hierarchy for Trading
Use these signals in context, not in isolation:
1. **INST BUY + INST SELL** → Highest conviction. Fresh institutional money with OI confirmation.
2. **ABSORB BUY + ABSORB SELL** → Strong level identification. Best used at known S/R.
3. **SHORT COVER + LONG UNWIND** → Trend exhaustion warning. OI falling means the move has less backing.
**Pro tip:** When INST BUY and ABSORB BUY appear within 2–3 bars of each other at the same level, it is a very high-conviction long setup — institutional buying confirmed both by new long entries AND by rejection of sellers at that level.
## Companion Indicator
**OF Part B: Exhaustion + Divergence + Flip** — covers Buyer/Seller Exhaustion, Delta Divergence (Lesson 4 methodology), and Delta Flip signals. Apply both together for complete institutional flow coverage across all 12 signal types.
*This indicator is for educational and informational purposes. All trading involves risk. Past signals do not guarantee future results.*
The information and publications are not meant to be, and do not constitute, financial, investment, trading, or other types of advice or recommendations supplied or endorsed by GoCharting. Read more in the Terms of Use.
Comments (3)
Loading comments…