Trendlines

This script's source code is protected by the author.
Trendlines with Breaks
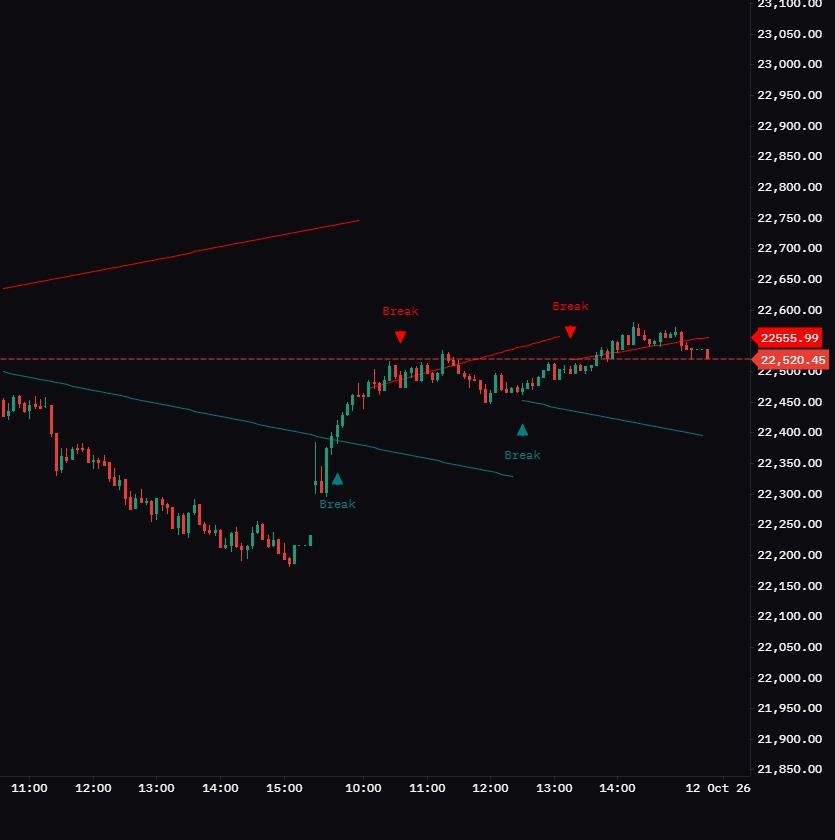
This indicator automatically draws sloping trendlines from recent swing highs and swing lows, and marks the moment price breaks through them.
How it works:
A down-sloping line (red) is drawn from each swing high and acts as resistance.
An up-sloping line (teal) is drawn from each swing low and acts as support.
The line slope is calculated from market volatility, so it adapts to each symbol and timeframe.
A Break arrow appears when price closes beyond a trendline.
What’s unique in this version:
A Break Buffer makes price clear the line by a set amount of ATR before a break is marked. This helps cut weak, false breakouts.
Settings:
Swing Detection Lookback: how many bars are used to confirm a swing point. Higher values give fewer, more significant lines.
Slope: makes the lines steeper or flatter.
Slope Calculation Method: ATR, Standard Deviation, or Linear Regression.
Break Buffer: use 0 for every break, or higher for stronger confirmation.
Colors: choose your own trendline colors.
How to use it:
A green arrow after a close above the red line suggests a bullish breakout.
A red arrow after a close below the teal line suggests a bearish breakdown.
Combine with volume, support/resistance, or a higher-timeframe trend for confirmation.
Note: Lines are drawn in real time and swing points are confirmed after the lookback period, so signals are never repainted.
The information and publications are not meant to be, and do not constitute, financial, investment, trading, or other types of advice or recommendations supplied or endorsed by GoCharting. Read more in the Terms of Use.
Related Scripts
Comments (0)
Loading comments…