← All Scripts
ProtectedTrend
BUY SELL SIGNAL

This script's source code is protected by the author.
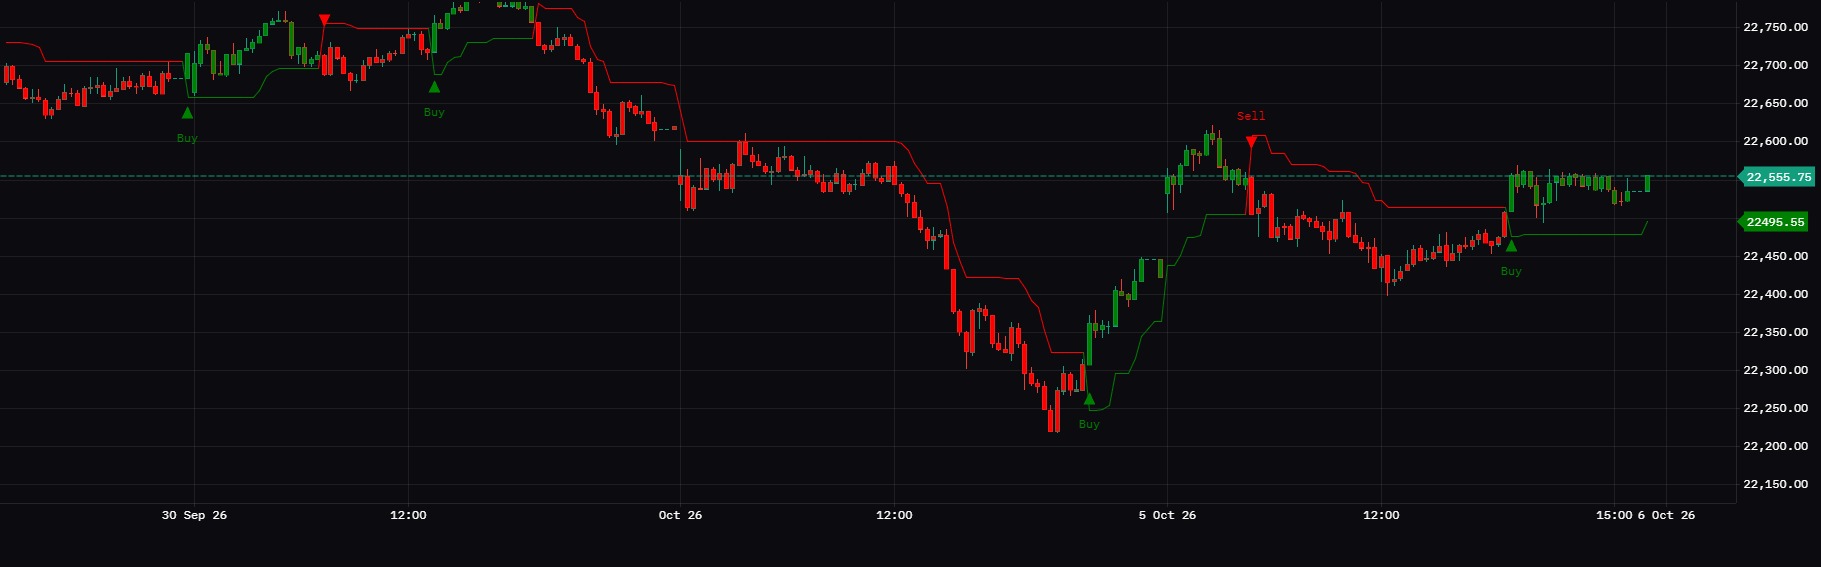
BUY SELL SIGNAL is a simple trend-following tool that plots a trailing stop line based on market volatility (ATR).
How to read it:
- Green line + Buy marker: price has closed above the stop, which suggests an uptrend.
- Red line + Sell marker: price has closed below the stop, which suggests a downtrend.
- Candles turn green or red to match the current trend.
Settings:
- Key Value: controls sensitivity. Higher values give fewer, slower signals. Lower values give more, faster signals.
- ATR Period: the volatility lookback (default 10).
Tips:
- It works best in trending markets and can give false signals in sideways ones.
- Confirm signals with support/resistance, volume, or a higher-timeframe trend.
- Adjust the settings to suit your symbol and timeframe. .
Disclaimer
The information and publications are not meant to be, and do not constitute, financial, investment, trading, or other types of advice or recommendations supplied or endorsed by GoCharting. Read more in the Terms of Use.
Related Scripts
Comments (1)
Loading comments…