SQZMOM

This script's source code is protected by the author.
Squeeze Momentum Indicator
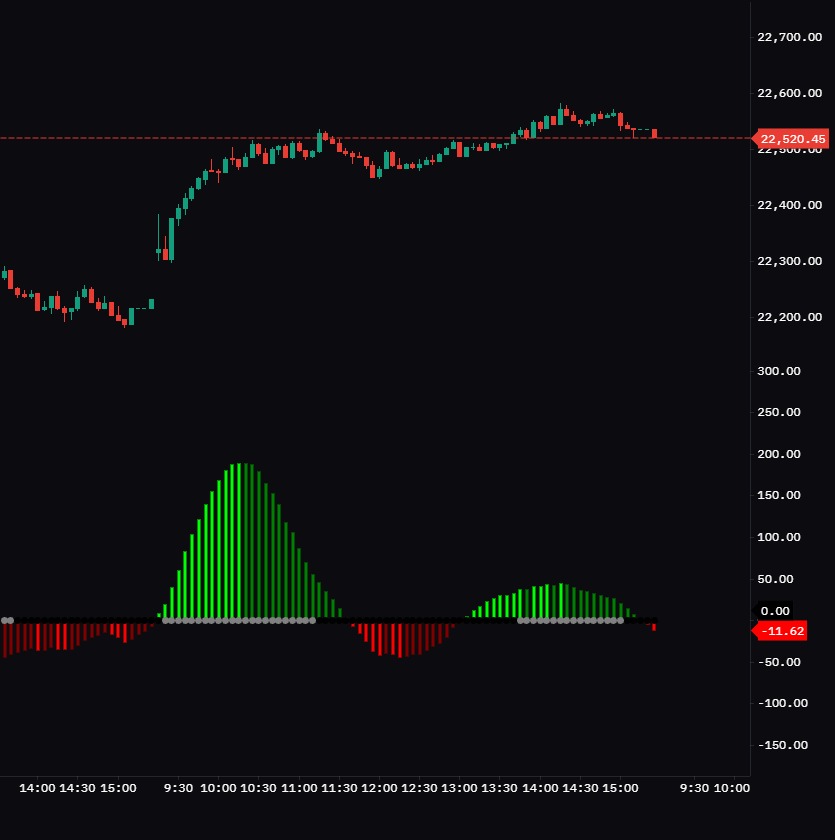
This indicator shows when the market is “squeezed” (low volatility) and which way momentum is building, so you can spot a possible breakout early.
The center dots show the squeeze state:
Black: squeeze on. Volatility is compressed and a big move may be coming.
Gray: squeeze off. The compression has released and the move may be starting.
Blue: no squeeze. The market is in a normal state.
The histogram shows momentum direction:
Lime: positive and rising (strong bullish momentum).
Green: positive but weakening.
Red: negative and falling (strong bearish momentum).
Maroon: negative but weakening.
How to use it:
Wait for the black dots, then watch for the first gray dot. Trade in the direction the histogram points.
A color change from lime to green, or from red to maroon, can warn that momentum is fading.
Confirm with trend, support/resistance, or volume to avoid false breakouts.
Settings: you can adjust the Bollinger Band and Keltner Channel lengths and multipliers.
The information and publications are not meant to be, and do not constitute, financial, investment, trading, or other types of advice or recommendations supplied or endorsed by GoCharting. Read more in the Terms of Use.
Related Scripts
Comments (0)
Loading comments…