Nadaraya-Watson Envelope

This script's source code is protected by the author.
Nadaraya-Watson Envelope
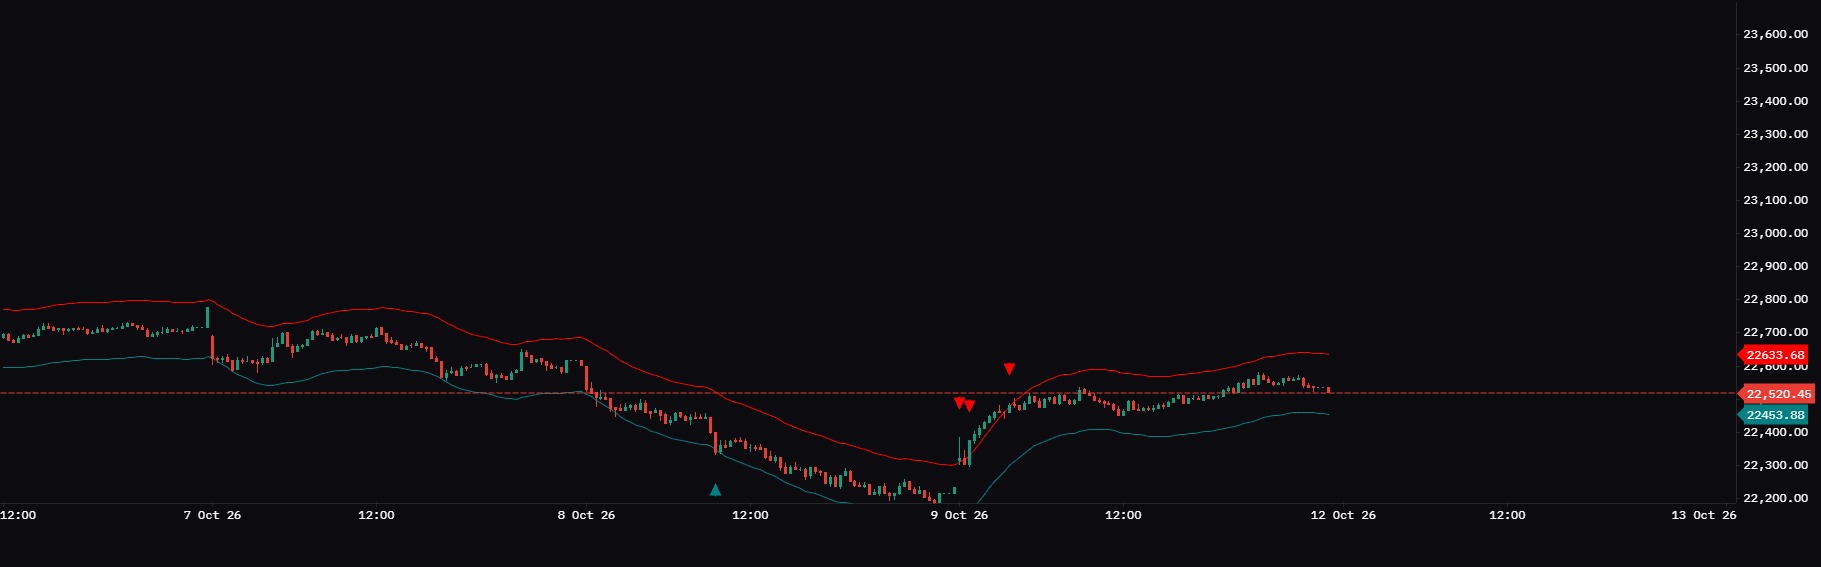
This indicator draws a smooth, adaptive envelope around price using Nadaraya-Watson kernel regression. A Gaussian-weighted average of recent closes forms the center line, and an upper and lower band are placed at a volatility-based distance from it.
How it works:
Recent bars are weighted by a Gaussian curve, so the newest bars count the most. This gives a smooth estimate of fair value.
The band width is the average distance between price and the estimate, multiplied by your chosen factor.
A green arrow (below the bar) appears when price crosses under the lower band, which suggests a possible oversold bounce.
A red arrow (above the bar) appears when price crosses over the upper band, which suggests a possible overbought pullback.
Settings:
Bandwidth: lower values follow price closely, higher values give a smoother line.
Multiplier: controls how wide the bands are.
Kernel Window: how many bars are used in the calculation.
Envelope Width Length: the lookback used to measure band distance.
Colors: choose your own band and signal colors.
How to use it:
It suits ranging or mean-reverting markets best. In strong trends, price can stay outside the bands for a long time.
Confirm signals with trend, support/resistance, or volume.
Note: This version uses the non-repainting method, so plotted values don’t change after the bar closes.
The information and publications are not meant to be, and do not constitute, financial, investment, trading, or other types of advice or recommendations supplied or endorsed by GoCharting. Read more in the Terms of Use.
Related Scripts
Comments (0)
Loading comments…