GoCharting vs TradingView for futures traders
Current as of October 30, 2026. TradingView plans, prices, limits and documentation quotes below come from TradingView’s own public pages on that date, named in Sources. TradingView changes its plans and features; check its current pages before you buy.
GoCharting and TradingView both offer Footprint, TPO and a DOM for US futures. The practical differences are how each produces the buy/sell volume split, which order-flow charts work in Bar Replay, and what a working futures setup costs once exchange data and market depth are added.
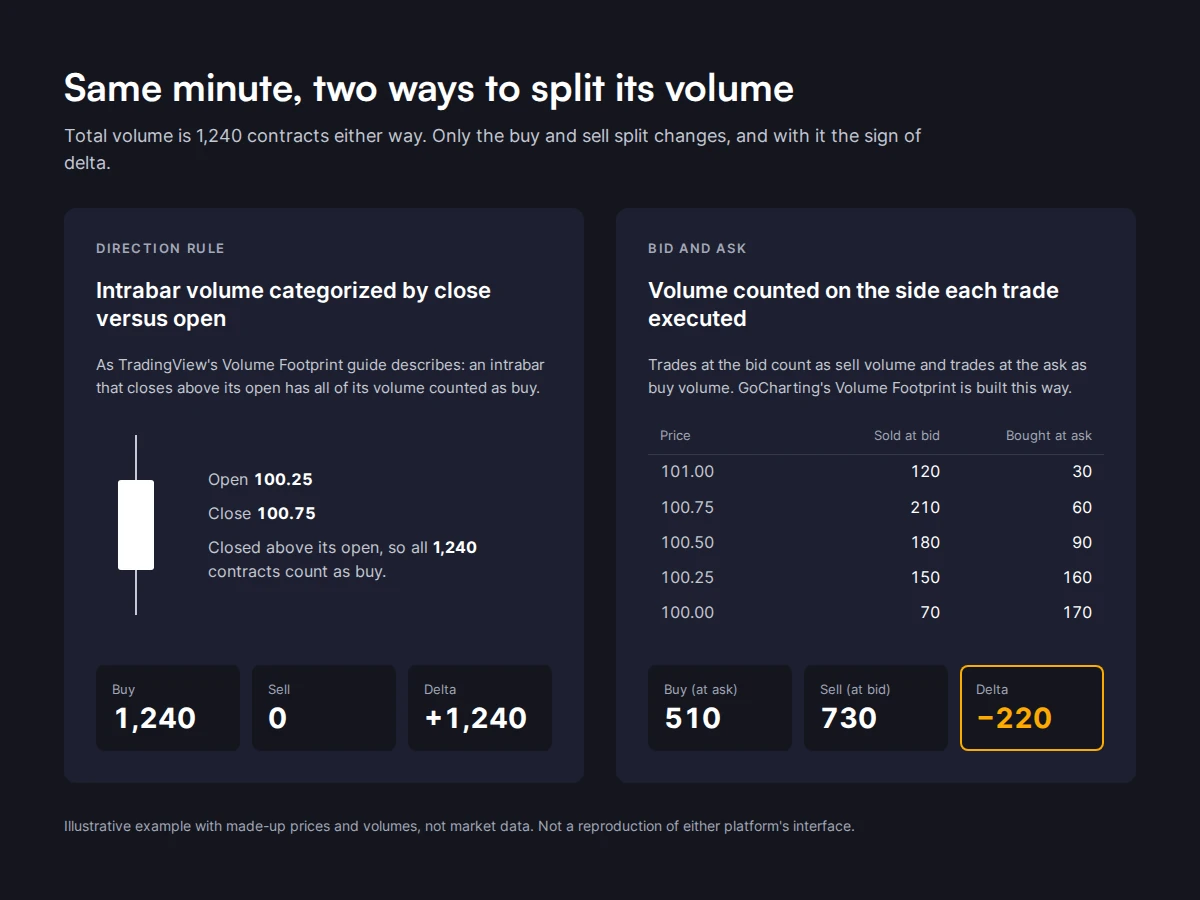
TradingView’s Volume Footprint guide says it categorizes volume as “buy” or “sell” based on the direction of intrabar price movements. GoCharting’s order flow tools show volume traded at the bid and ask at each price, from tick-by-tick CME Group data.
TradingView has the larger script library, a large publishing community and broad multi-asset coverage. GoCharting is built around the futures order-flow workflow: Footprint, Delta, CVD, DOM, Time & Sales and replay in one browser workspace.
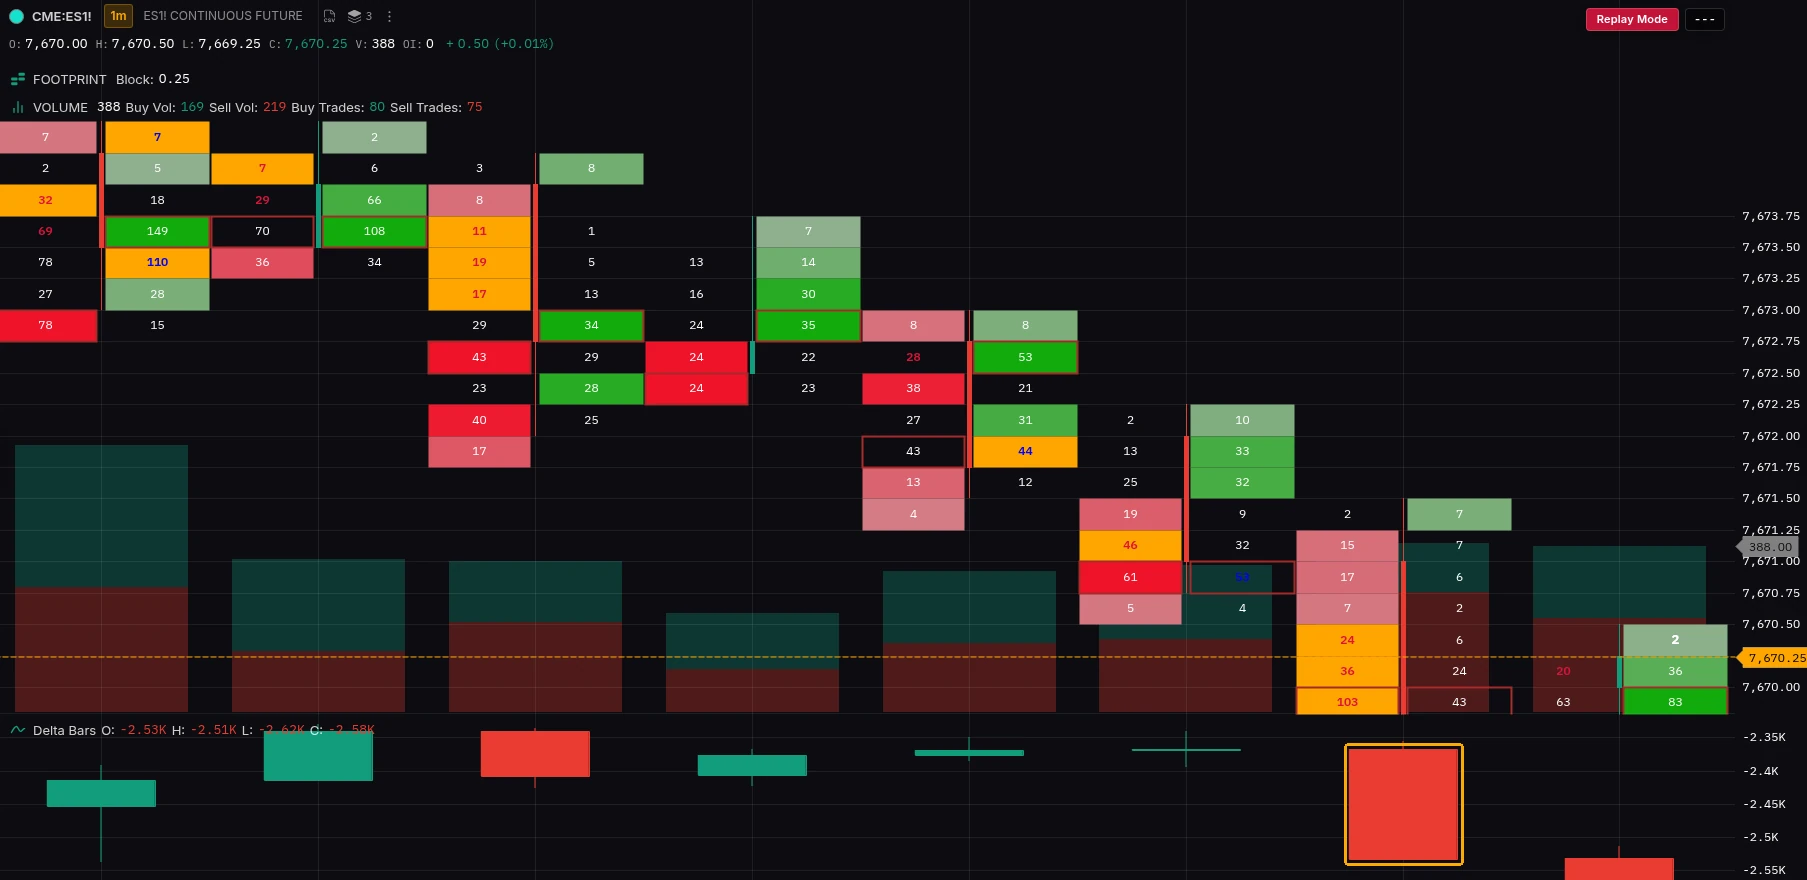
CME:ES1! (continuous) · 1-minute · Advanced Bar Replay (beta) · paid plan · historical data · captured 30 Oct 2026
The market data, and all rights in and to it, are the property of Chicago Mercantile Exchange Inc. or its licensors as applicable. All rights reserved, except as expressly licensed by Chicago Mercantile Exchange Inc.
Key facts at a glance
| Feature | GoCharting | TradingView |
|---|---|---|
| Platform + real-time CME data, month-to-month (8 charts per tab) | $30/mo | $76.95/mo (Premium $69.95 + CME data $7) |
| Same, billed annually | $29/mo | $66.95/mo (Premium $59.95 + CME data $7) |
| Level 2 depth for the DOM | CME Group Bundle L2 option | Through your connected broker; cost varies |
| Buy/sell volume source | Volume traded at bid and ask | Categorized by intrabar price direction |
| Footprint in Bar Replay | Yes | Not supported, per TradingView’s Bar Replay guide |
| Time & Sales (Trades & Order Book) | Yes, paid plans | Not listed on TradingView’s plan comparison |
| Built-in indicators per chart | Unlimited | 2 / 5 / 10 / 25 / 50 by tier |
| Intraday Bar Replay on the free plan | 9,000 bars | Daily and higher only on Basic |
Why futures traders compare the two
Total setup cost. A futures setup can involve a platform plan, real-time exchange data and market depth for the DOM. Compare the full configuration you need, on the same billing period, for your professional or non-professional status.
Workspace capacity. On TradingView, chart, indicator and alert limits rise by tier. Eight charts in one tab needs Premium; a smaller layout fits a lower tier.
How order-flow data is produced. TradingView’s Footprint guide describes a buy/sell split based on intrabar price direction. GoCharting displays volume traded at the bid and ask. The difference matters when you review delta, imbalances and past Footprint values.
Quick verdict
You trade order flow. GoCharting fits when bid/ask volume, Footprint, DOM, Time & Sales and order-flow replay are central to your futures session.
You rely on Pine Script. List the scripts you actually use. TradingView’s public script library is far larger. Lipi, GoCharting’s scripting language, lets you build custom indicators that work with order-flow data; scripts from other platforms are rebuilt in Lipi.
You already trade through a futures broker. You can test GoCharting without moving your account. Supported US futures connections include Optimus Futures, Rithmic, TradeStation, Tradovate and EdgeClear.
You want to evaluate without paying. GoCharting Free includes unlimited built-in indicators, 9,000-bar intraday Bar Replay and basic profile indicators, on end-of-day data. TradingView Basic includes CME Group data on a 10-minute delay and Bar Replay on daily and higher timeframes.
You need a large community script library, published ideas or broad multi-asset coverage. TradingView is the better fit, and many traders run both.
GoCharting vs TradingView pricing
For an eight-chart futures workspace with real-time CME Group data, GoCharting lists $30 a month and TradingView $76.95 a month (Premium plus CME data), both before Level 2 depth.
How prices are compared. Each row compares both platforms’ US prices on the same billing basis, in US dollars, for non-professional exchange status, excluding taxes. GoCharting prices are standard rates with no promotion applied. TradingView’s pricing page labels its current annual rates “special price”; they are shown as published. Both platforms price differently by country, so readers outside the US may see other prices and plan contents. Level 2 depth is shown separately for both platforms because its cost depends on the plan or broker.
What each platform charges
TradingView’s pricing page lists billed-annually rates of $12.95 a month for Essential, $29.95 for Plus, $59.95 for Premium and $199.95 for Ultimate. Premium is $69.95 month-to-month. Charts per tab are 2, 4, 8 and 16; indicators per chart are 5, 10, 25 and 50; price alerts are 20, 100, 400 and 1,000.
TradingView bills real-time exchange data separately. Its pricing FAQ says extra real-time data for exchanges including CME “are available to be added separately to your account.” Its CME Group futures page lists real-time CME, CBOT, COMEX and NYMEX data at $7.00 a month for non-professional subscribers, and CME Group data free on a 10-minute delay.
GoCharting’s CME Futures package is $30 a month, or $29 a month billed annually. It covers CME, CBOT, NYMEX and COMEX with tick-by-tick real-time data, exchange data included. Paid plans include Footprint and imbalance charts, orderflow indicators, CVD and Commitment of Traders, Power Trades, Time & Sales, 100 price and delta alerts, a delta-based scanner, webhooks, 8 charts per tab, 25 concurrent charts, 200 saved layouts and 15,000-bar intraday Bar Replay. Full Level 2 depth is the CME Group Bundle L2 option.
What a working setup costs
Example setup: ES and NQ with Footprint, a DOM, Time & Sales and about 100 alerts across eight charts in one tab.
| Cost line | GoCharting | TradingView |
|---|---|---|
| Plan | CME Futures package | Premium (needed for 8 charts per tab) |
| Real-time CME Group data | Included | $7/mo |
| Total, month-to-month | $30 | $76.95 |
| Total, billed annually | $29 | $66.95 |
| Level 2 depth for the DOM | CME Group Bundle L2 option | Broker-supplied; cost varies by broker |
| Time & Sales (Trades & Order Book) | Included | Not listed on TradingView’s plan comparison |
| Indicators per chart | Unlimited | 25 |
For a smaller workspace TradingView costs less. Essential plus CME data is $19.95 a month billed annually, for two charts per tab, five indicators per chart and 20 price alerts.
Which GoCharting plan to choose
ES, NQ or any CME Group product with order flow. The CME Futures package covers CME, CBOT, NYMEX and COMEX with the Footprint and profile tools and 15,000-bar Bar Replay.
Full Level 2 depth on the DOM. Add the CME Group Bundle L2 option.
Evaluating first. Start on Free: basic Market Profile and Volume Profile indicators, 9,000-bar intraday Bar Replay, unlimited built-in indicators, 90+ drawing tools, Lipi, paper trading and the mobile apps, on end-of-day data, with no credit card. Paid plans include a 7-day trial.
A funded account. GoCharting supports TopStep, Apex, FTMO and most prop firm Rithmic, CQG and Tradovate feeds. The plan is the same CME Futures package.
Plans can be canceled at any time; see the refund and cancellation terms.
The free plans compared
GoCharting Free and TradingView Basic trade off differently: GoCharting gives more tools on end-of-day data, TradingView gives delayed intraday CME data with fewer tools.
| Feature | GoCharting Free | TradingView Basic |
|---|---|---|
| CME Group data | End-of-day | 10-minute delayed |
| Built-in indicators per chart | Unlimited | 2 |
| Charts per tab | 2 | 1 |
| Saved layouts | 30 | 1 |
| Watchlists | 5, 100 symbols each | 1, 30 symbols |
| Intraday Bar Replay | 9,000 bars | Not included |
| Daily and higher Bar Replay | Yes | Yes, all available history |
| Market Profile and Volume Profile | Basic indicators | Not included |
| Price alerts | Not included | 3, one-month duration |
| Drawing tools | 90+ | 110+ |
| Paper trading | Included | Included |
GoCharting vs TradingView: full comparison
GoCharting values are from its US pricing and feature pages; TradingView values are from its pricing page and help center, all as of October 30, 2026.
Order flow and market data
| Feature | GoCharting | TradingView |
|---|---|---|
| Buy/sell volume source | Volume traded at bid and ask | Categorized by intrabar price direction |
| Intrabar source for history | Tick data | 1 tick (professional plans) → 1 second → 1 minute → 60 minutes |
| Footprint views | Bid/Ask, Volume, Delta | Buy and Sell, Delta, Total, Ladder |
| Imbalance detection | Yes | Yes, 300% default, stacked imbalances |
| Per-bar metrics | 21+ | 15 named Table-mode metrics |
| CVD | From bid/ask volume | Session CVD from categorized volume |
| Commitment of Traders | Yes, paid plans | Not listed |
| Power Trades (large print markers) | Yes, paid plans | Not listed |
| Time & Sales (Trades & Order Book) | Yes, paid plans | Not listed on plan comparison |
| Market Profile / TPO | Basic on Free; Advanced on paid plans | Yes, paid plans |
| Volume Profile | Basic on Free; full on paid plans | Yes, paid plans |
| Level 2 depth | CME Group Bundle L2 option | Through connected broker |
| DOM trading | Yes | Yes, through connected broker |
Charting and workspace
| Feature | GoCharting Free | GoCharting paid | TradingView (Basic / Essential / Plus / Premium / Ultimate) |
|---|---|---|---|
| Charts per tab | 2 | 8 | 1 / 2 / 4 / 8 / 16 |
| Concurrent charts | 4 | 25 | 2 / 10 / 20 / 50 / 200 |
| Saved layouts | 30 | 200 | 1 / 5 / 10 / unlimited / unlimited |
| Built-in indicators per chart | Unlimited | Unlimited | 2 / 5 / 10 / 25 / 50 |
| Drawing tools | 90+ | 90+ | 110+ |
| Historical bars | 9,000 | 15,000 | 5,000 / 10,000 / 10,000 / 20,000 / 40,000 |
| Devices | 1 | 3 | Not listed |
Bar Replay
| Feature | GoCharting | TradingView |
|---|---|---|
| Free plan | 9,000 bars intraday | Daily and higher timeframes |
| Paid plans, intraday | 15,000 bars | 1-minute: 180 days Essential, 365 days Plus, all history Premium and Ultimate |
| Footprint in replay | Yes | Listed as not working with Bar Replay |
| TPO in replay | Yes | Listed as not working with Bar Replay |
| Paper orders during replay | Yes, Advanced Bar Replay (beta), paid plans | Executed on real-time data |
| Tick replay | Not listed | Ultimate, 7 days |
Alerts and scripting
| Feature | GoCharting paid | TradingView |
|---|---|---|
| Price alerts | 100 price and delta alerts | 20 / 100 / 400 / 1,000 by tier |
| Footprint-based alerts | Delta alerts | Imbalance, Volume Delta, Total Buy and Sell Volume conditions |
| Indicator alerts | 5 | 20 / 100 / 400 / 1,000 technical alerts by tier |
| Scanner | Delta-based scanner and watchlist | Pine Screener on paid plans |
| Webhooks | Yes | Yes, paid plans |
| Scripting language | Lipi | Pine Script |
| Public script library | Growing | 100K+ community indicators |
Platform and trading
| Feature | GoCharting | TradingView |
|---|---|---|
| Access | Browser on Mac, Windows, Linux, Chromebook, iPad; Android and iOS apps | Web, desktop and mobile apps |
| Chart trading | Paid plans | Yes |
| Watchlist trading | Paid plans | Not listed |
| Paper trading | All plans | All plans |
| Support | Discord and email (Free); WhatsApp (paid) | Regular to first-priority by tier |
“Not listed” means the item does not appear on the pages cited; it is not a statement that the feature does not exist.
How each platform produces buy and sell volume
TradingView: categorized by intrabar direction
TradingView’s Volume Footprint guide says the chart retrieves volume from intervals lower than the chart’s and categorizes it by intrabar direction:
“If the intrabar’s closing price exceeds its opening price, it assigns the volume to the ‘buy’ category.”
The guide applies the opposite rule for sell volume. When open equals close, it compares closes with the previous intrabar. Volume Delta and Session CVD are built from these categorized figures.
The intrabar interval also changes with history. For intraday charts the guide lists “1 tick (for professional plans) → 1 second → 1 minute → 60 minutes,” with recent candles the most precise.
GoCharting: volume traded at bid and ask
GoCharting streams tick-by-tick CME Group data and shows the volume traded at the bid and ask at each price level. Delta is the difference between aggressive buying and selling in each bar; CVD tracks it over time.
What the difference means in practice
Both points below follow from TradingView’s published method, not from side-by-side testing.
Absorption. In absorption, aggressive buying fills into resting sell orders and price does not rise. Under a direction-based rule, that volume can be categorized as selling, because the input is the intrabar’s close versus its open rather than the side each trade executed on.
Delta divergence. A divergence compares aggression with price. When delta is derived from price direction, both sides of the comparison share an input, and the effect depends on the intrabar interval in use.
Does TradingView’s Footprint repaint?
TradingView addresses this in the Alerts section of its Volume Footprint guide, under “Important notes on interpretation”:
“When interpreting alert results for Volume Footprints, keep in mind that this study is repainting by design. In real time, the chart may use one intrabar data source (e.g., 1T) for calculations, while the same bar may later be recalculated using a less granular interval (e.g., 1S) as more historical data becomes available. This means that the appearance of imbalances — and therefore alert triggers — can differ slightly between real-time execution and historical review.”
TradingView describes the difference as slight. If you journal trades from Footprint screenshots, save the chart at the time of the trade, because a later view may differ.
GoCharting’s historical Footprint is built from the recorded tick data, so past bars show the same values when you review them later.
Footprint charts
TradingView’s Footprint offers Buy and Sell, Delta, Total and Ladder views, manual or ATR-based row size, POC and Value Area, Cluster and Profile display, and imbalance detection with a 300% default and stacked levels. Its Table mode lists 15 per-bar metrics, including Delta, Min and Max delta, Session CVD and open interest.
GoCharting’s Footprint and cluster charts show bid and ask volume at each price level, with imbalance charts and 21+ per-bar metrics. Power Trades marks prints above a size you set. Footprint, DOM, Time & Sales, CVD and Commitment of Traders sit in one workspace.
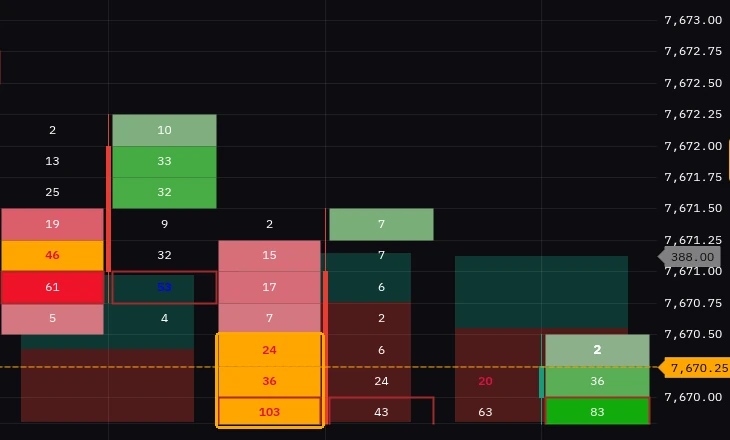
CME:ES1! (continuous) · 1-minute · Advanced Bar Replay (beta) · paid plan · historical data · captured 30 Oct 2026
The market data, and all rights in and to it, are the property of Chicago Mercantile Exchange Inc. or its licensors as applicable. All rights reserved, except as expressly licensed by Chicago Mercantile Exchange Inc.
The controls are broadly comparable; the choice turns on whether imbalances are calculated from bid/ask volume or from direction-categorized volume. For a full walkthrough, see our Footprint charts guide.
TPO and Volume Profile
On TradingView, Volume Profile and Time Price Opportunity are paid-plan features. GoCharting’s paid plans include Advanced Market Profile with POC, Value Area, single prints and merge/unmerge, plus session, composite, fixed-range and anchored Volume Profile, built from tick data. Basic Market Profile and Volume Profile indicators are on GoCharting Free.
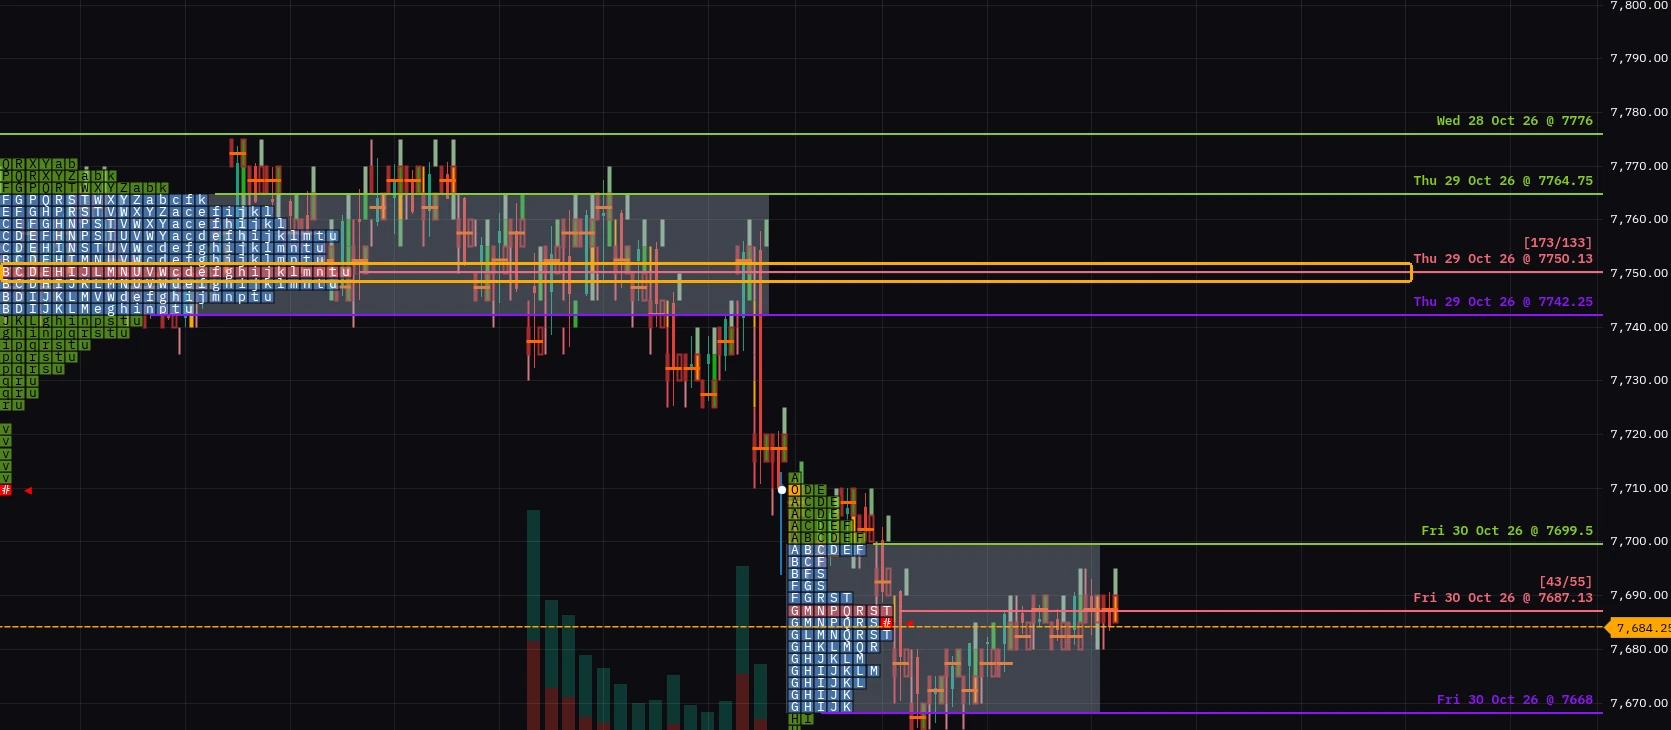
CME:ES1! (continuous) · 30-minute · Market Profile · historical data · captured 30 Oct 2026
The market data, and all rights in and to it, are the property of Chicago Mercantile Exchange Inc. or its licensors as applicable. All rights reserved, except as expressly licensed by Chicago Mercantile Exchange Inc.
CVD and Delta
TradingView’s Session CVD accumulates the categorized delta described above and resets daily on intraday charts. GoCharting’s Delta measures aggressive buying minus selling in each bar, with CVD (the Delta Bars indicator with Cumulative switched on) tracking it over time and an alert when bar Delta crosses a threshold you set.
DOM and Time & Sales
TradingView offers DOM trading through a connected broker, which supplies the depth data.
On GoCharting, US CME Group Level 2 depth is available through the CME Group Bundle L2 option on GoCharting’s own feed, with no separate broker depth subscription. Paid plans include a Time & Sales tape, called Trades & Order Book in Terminal V2’s right-hand sidebar, showing the size, price and time of each trade. TradingView’s plan comparison does not list a Time & Sales tape.
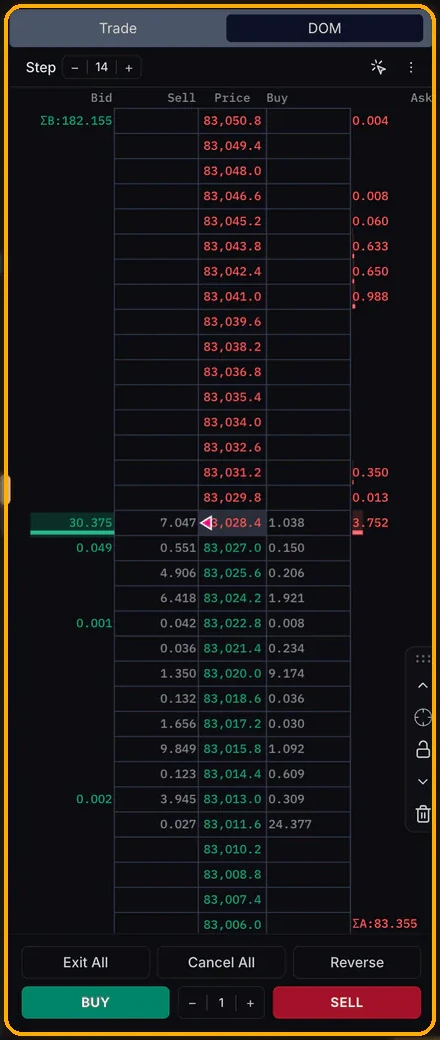
Depth of Market ladder in Terminal V2, shown on a crypto perpetual. CME Group depth needs the CME Group Bundle L2 option. Source: GoCharting Terminal V2 announcement.
Bar Replay with order-flow charts
TradingView offers deeper replay history on its upper tiers: 1-minute data for 180 days on Essential, 365 days on Plus and all available history on Premium and Ultimate, plus 7 days of tick replay on Ultimate. Daily and higher timeframes replay on every plan, including Basic.
TradingView’s Bar Replay guide lists chart types that do not work with Bar Replay, including Volume footprint and Time Price Opportunity. The same guide notes that new server-side alerts cannot be generated during replay and that trading orders, including Paper Trading, execute on real-time data.
GoCharting includes intraday Bar Replay: Simple Bar Replay with 9,000 bars on Free, and Advanced Bar Replay (beta) on paid plans, with 15,000 bars, synchronized replay across charts, adjustable speed and simulated orders. Footprint and TPO stay available during replay.
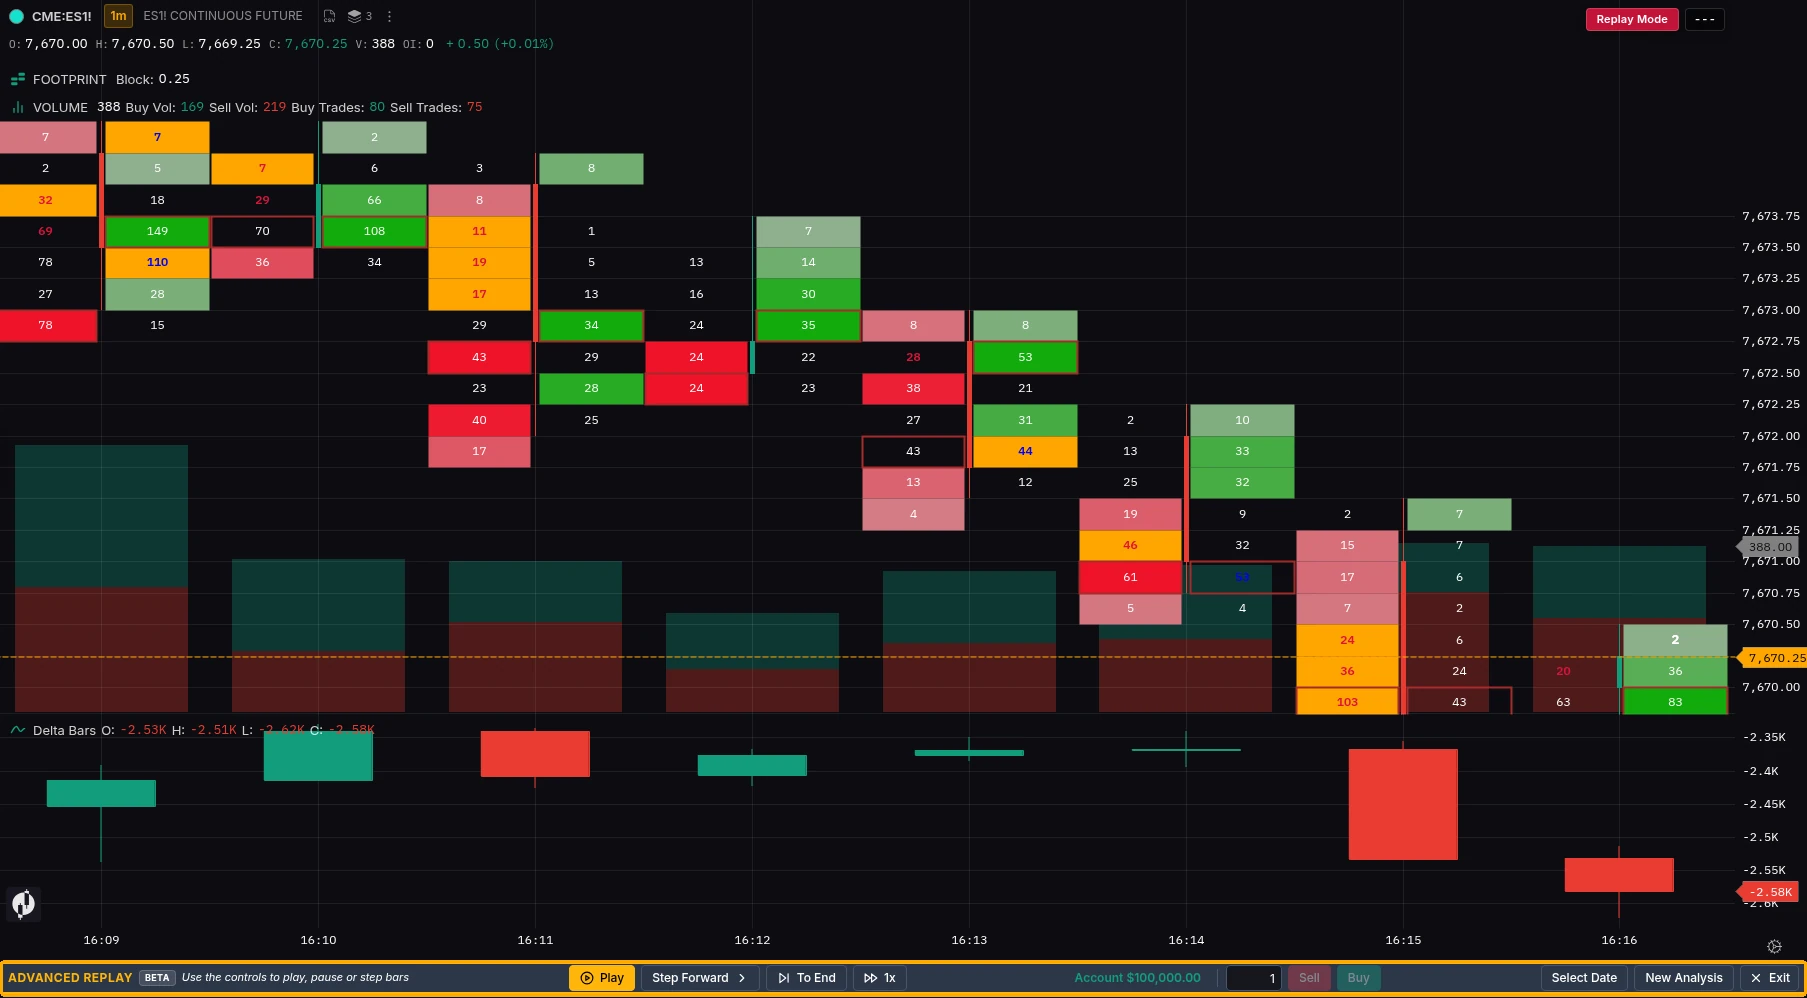
CME:ES1! (continuous) · 1-minute · Advanced Bar Replay (beta) · paid plan · historical data · simulated balance · captured 30 Oct 2026
The market data, and all rights in and to it, are the property of Chicago Mercantile Exchange Inc. or its licensors as applicable. All rights reserved, except as expressly licensed by Chicago Mercantile Exchange Inc.
TradingView has more replay history; GoCharting shows Footprint inside replay.
Alerts and scripting
TradingView’s alert limits rise by tier, from 20 price and 20 technical alerts on Essential to 1,000 each on Ultimate. Its Volume Footprint chart supports alerts on new and stacked imbalances, Volume Delta, and Total Buy and Sell Volume.
GoCharting’s paid plans include 100 price and delta alerts, 5 indicator alerts, alert webhooks, and a delta-based scanner and watchlist, with real-time CME Group data in the same plan price.
Lipi is GoCharting’s scripting language for custom indicators. Lipi scripts can work with order-flow data such as delta and footprint volume, alongside price and volume. Scripts written for other platforms do not run in GoCharting and are rebuilt in Lipi; see the Lipi reference.
TradingView’s community library is far larger. If your process depends on finding and adapting published scripts, that is a strong reason to keep a TradingView account.
Data feeds: exchange data, Level 2, Rithmic and CQG
Exchange data makes a chart real-time. Through TradingView, real-time CME, CBOT, COMEX and NYMEX data is $7 a month for non-professional subscribers. GoCharting’s CME Futures package includes it.
Level 2 depth is a separate entitlement from chart data. On TradingView it comes from your connected broker. On GoCharting, US CME Group depth is the CME Group Bundle L2 option.
Rithmic and CQG are market data and order-routing gateways rather than brokers. Many futures brokers and prop firms use one or the other. GoCharting connects through both.
Professional or non-professional status changes exchange fees on both platforms. Confirm which applies to you before budgeting.
US futures brokers and prop firms
GoCharting’s US futures broker page lists Optimus Futures, Rithmic, TradeStation, Tradovate and EdgeClear. Orders placed from the chart go through your connected broker.
For funded accounts, GoCharting supports TopStep, Apex, FTMO and most prop firm Rithmic, CQG and Tradovate feeds. Orderflow tools, risk monitoring and Bar Replay let you review trades against a firm’s drawdown rules in one application.
If you already use a supported connection, testing GoCharting does not require moving your brokerage account. See the full broker list for current integrations, including Indian, crypto and forex connections.
Platform access
GoCharting runs in a modern browser on Mac, Windows, Linux, Chromebook and iPad, with no install and no license key tied to a machine. Android and iOS apps, multi-device sync and push alerts are included on every plan. Free allows one device and Premium three.
TradingView offers web, desktop and mobile apps with synced layouts.
Where TradingView is stronger
Script library. TradingView lists 100K+ community-powered indicators, with years of documentation behind Pine Script.
Community and publishing. Public ideas, published scripts and a large active user base.
Market breadth. Equities, FX, crypto, bonds and global indices in one place. If futures are one part of a wider book, that coverage counts.
Replay depth. Premium and Ultimate replay all available 1-minute history, and Ultimate adds 7 days of tick replay.
If you use Footprint occasionally and spend most of the day in Pine indicators and standard charts, moving your whole workflow may not be worth it. Many traders keep TradingView for scripts and broad markets and use GoCharting for the futures session.
Switching from TradingView to GoCharting
- Connect your broker. Link a supported futures or prop firm account; your brokerage account stays where it is.
- Review your scripts. List the indicators and alerts you actually use. Standard indicators have built-in equivalents; custom logic is rebuilt in Lipi.
- Set up one futures workspace. An ES or NQ layout with Footprint, DOM, Time & Sales and CVD is enough to judge the platform.
- Confirm your data. The CME Futures package covers charting, order flow and tick data across CME Group. Add the CME Group Bundle L2 option for full DOM depth, and check your non-professional status.
- Run both for a week. Use the same contract and session and compare the same bars on each.
Frequently asked questions
Which is better for futures order flow, GoCharting or TradingView?
It depends on your workflow. Both have Footprint, TPO and a DOM. GoCharting shows volume traded at the bid and ask and keeps Footprint available in Bar Replay. TradingView categorizes Footprint volume by intrabar direction, has the larger script library and covers more asset classes.
How do the two calculate Footprint and CVD?
TradingView categorizes volume from lower-timeframe intrabars: a close above the open counts as buy volume, below it as sell volume. The intrabar interval moves from 1 tick (professional plans) to 1 second, 1 minute and 60 minutes as history deepens. GoCharting shows volume traded at each bid and ask price, with Delta as aggressive buying minus selling.
Does TradingView have footprint charts?
Yes. Volume Footprint is on TradingView’s paid plans. Its guide describes the buy/sell split as based on intrabar direction and notes the study repaints by design, and its Bar Replay guide lists Footprint as a chart type that does not work in replay.
How much does each cost for a futures setup?
For eight charts per tab with real-time CME Group data: GoCharting $30 a month, or $29 billed annually; TradingView Premium plus CME data $76.95 month-to-month, or $66.95 billed annually. Level 2 depth is extra on both. For two charts per tab, TradingView Essential plus CME data is $19.95 a month billed annually.
Is there a free TradingView alternative?
GoCharting Free has no time limit and includes unlimited built-in indicators, 9,000-bar intraday Bar Replay, basic Market Profile and Volume Profile indicators, 90+ drawing tools, Lipi and paper trading, on end-of-day data. TradingView Basic includes 10-minute-delayed CME Group data, two indicators per chart and Bar Replay on daily and higher timeframes.
Can I use Pine Script in GoCharting?
No. Pine Script runs only in TradingView. Logic you want in GoCharting is rebuilt in Lipi; list the indicators you actually use first.
Can I get real-time CME data without a separate fee?
Real-time exchange data always carries an exchange fee; platforms differ in how they bill it. TradingView charges $7 a month on top of a paid plan. GoCharting’s CME Futures package includes it in the plan price.
Can I connect my current futures broker?
GoCharting lists Optimus Futures, Rithmic, TradeStation, Tradovate and EdgeClear. You keep your existing account, commissions and routing. See the broker list for current integrations.
Does GoCharting work with prop firms?
GoCharting supports TopStep, Apex, FTMO and most prop firm Rithmic, CQG and Tradovate feeds. Check the broker list for current coverage.
Does GoCharting run on Mac?
Yes. It runs in a browser on Mac, Windows, Linux, Chromebook and iPad, with no install.
What is the difference between CME Group Bundle and CME Group Bundle L2?
The CME Group Bundle covers real-time charting and order flow across CME Group. CME Group Bundle L2 adds full Level 2 depth for the DOM.
I only trade ES and NQ. What should I buy?
The CME Futures package covers all CME Group products, including ES and NQ. Add CME Group Bundle L2 for full DOM depth.
Does GoCharting have a free trial?
Paid plans include a 7-day trial. The Free plan has no time limit and needs no credit card.
Which one fits your setup
GoCharting fits US futures traders who want bid/ask volume, Footprint in Bar Replay, and a DOM and Time & Sales (Trades & Order Book) in one browser workspace. For the eight-chart setup priced above, it costs less than TradingView before Level 2 depth.
TradingView fits traders whose work runs on its script library, its community or several asset classes, and a switch does not have to be total.
Run the same ES or NQ session on both for a week and compare the same bars.
Disclaimers
GoCharting is a charting and analytics tool. This is not investment advice. Trading and investing carry a high risk of loss and are not suitable for everyone. You can lose some or all of your money. Leveraged products, including futures, can result in losses exceeding the amount deposited.
TradingView and Pine Script are trademarks of TradingView, Inc. Optimus Futures, Rithmic, TradeStation, Tradovate, EdgeClear, CQG, TopStep, Apex and FTMO are trademarks of their respective owners. GoCharting is independent and not affiliated with, endorsed by or sponsored by TradingView, Inc. or any other company named here. Comparison based on publicly available information as of October 30, 2026. Quotations from TradingView’s help center are short excerpts used for comparison and commentary, attributed to their source pages; all rights in them remain with TradingView, Inc.
CME Group data shown in any screenshot on this page: The market data, and all rights in and to it, are the property of Chicago Mercantile Exchange Inc. or its licensors as applicable. All rights reserved, except as expressly licensed by Chicago Mercantile Exchange Inc.
Sources
All pages fetched and checked on October 30, 2026. TradingView pages are named here for verification and are not linked.
- TradingView, Pricing (tradingview.com/pricing): plan prices, “special price” labels, charts per tab, indicators per chart, alerts, historical bars, Bar Replay depth by plan, extra real-time data FAQ.
- TradingView Help Center, “Volume footprint charts: a complete guide”: volume categorization, intrabar sequence, 300% imbalance default, Table-mode metrics, alert conditions, repainting note.
- TradingView Help Center, “Bar Replay: how and why to test a strategy in the past”: chart types not supported in replay, server-side alerts, order execution during replay.
- TradingView, CME Group futures page (tradingview.com/cme): $7.00 non-professional real-time fee, 10-minute delayed free data.
- GoCharting, Pricing: plan contents and limits.
- GoCharting, Order flow: Footprint, Delta, CVD, Time & Sales, Power Trades.
- GoCharting, CME Group market data: exchanges and tick data.
- GoCharting, US futures brokers: supported US futures connections.