engulf swing HL
Overview
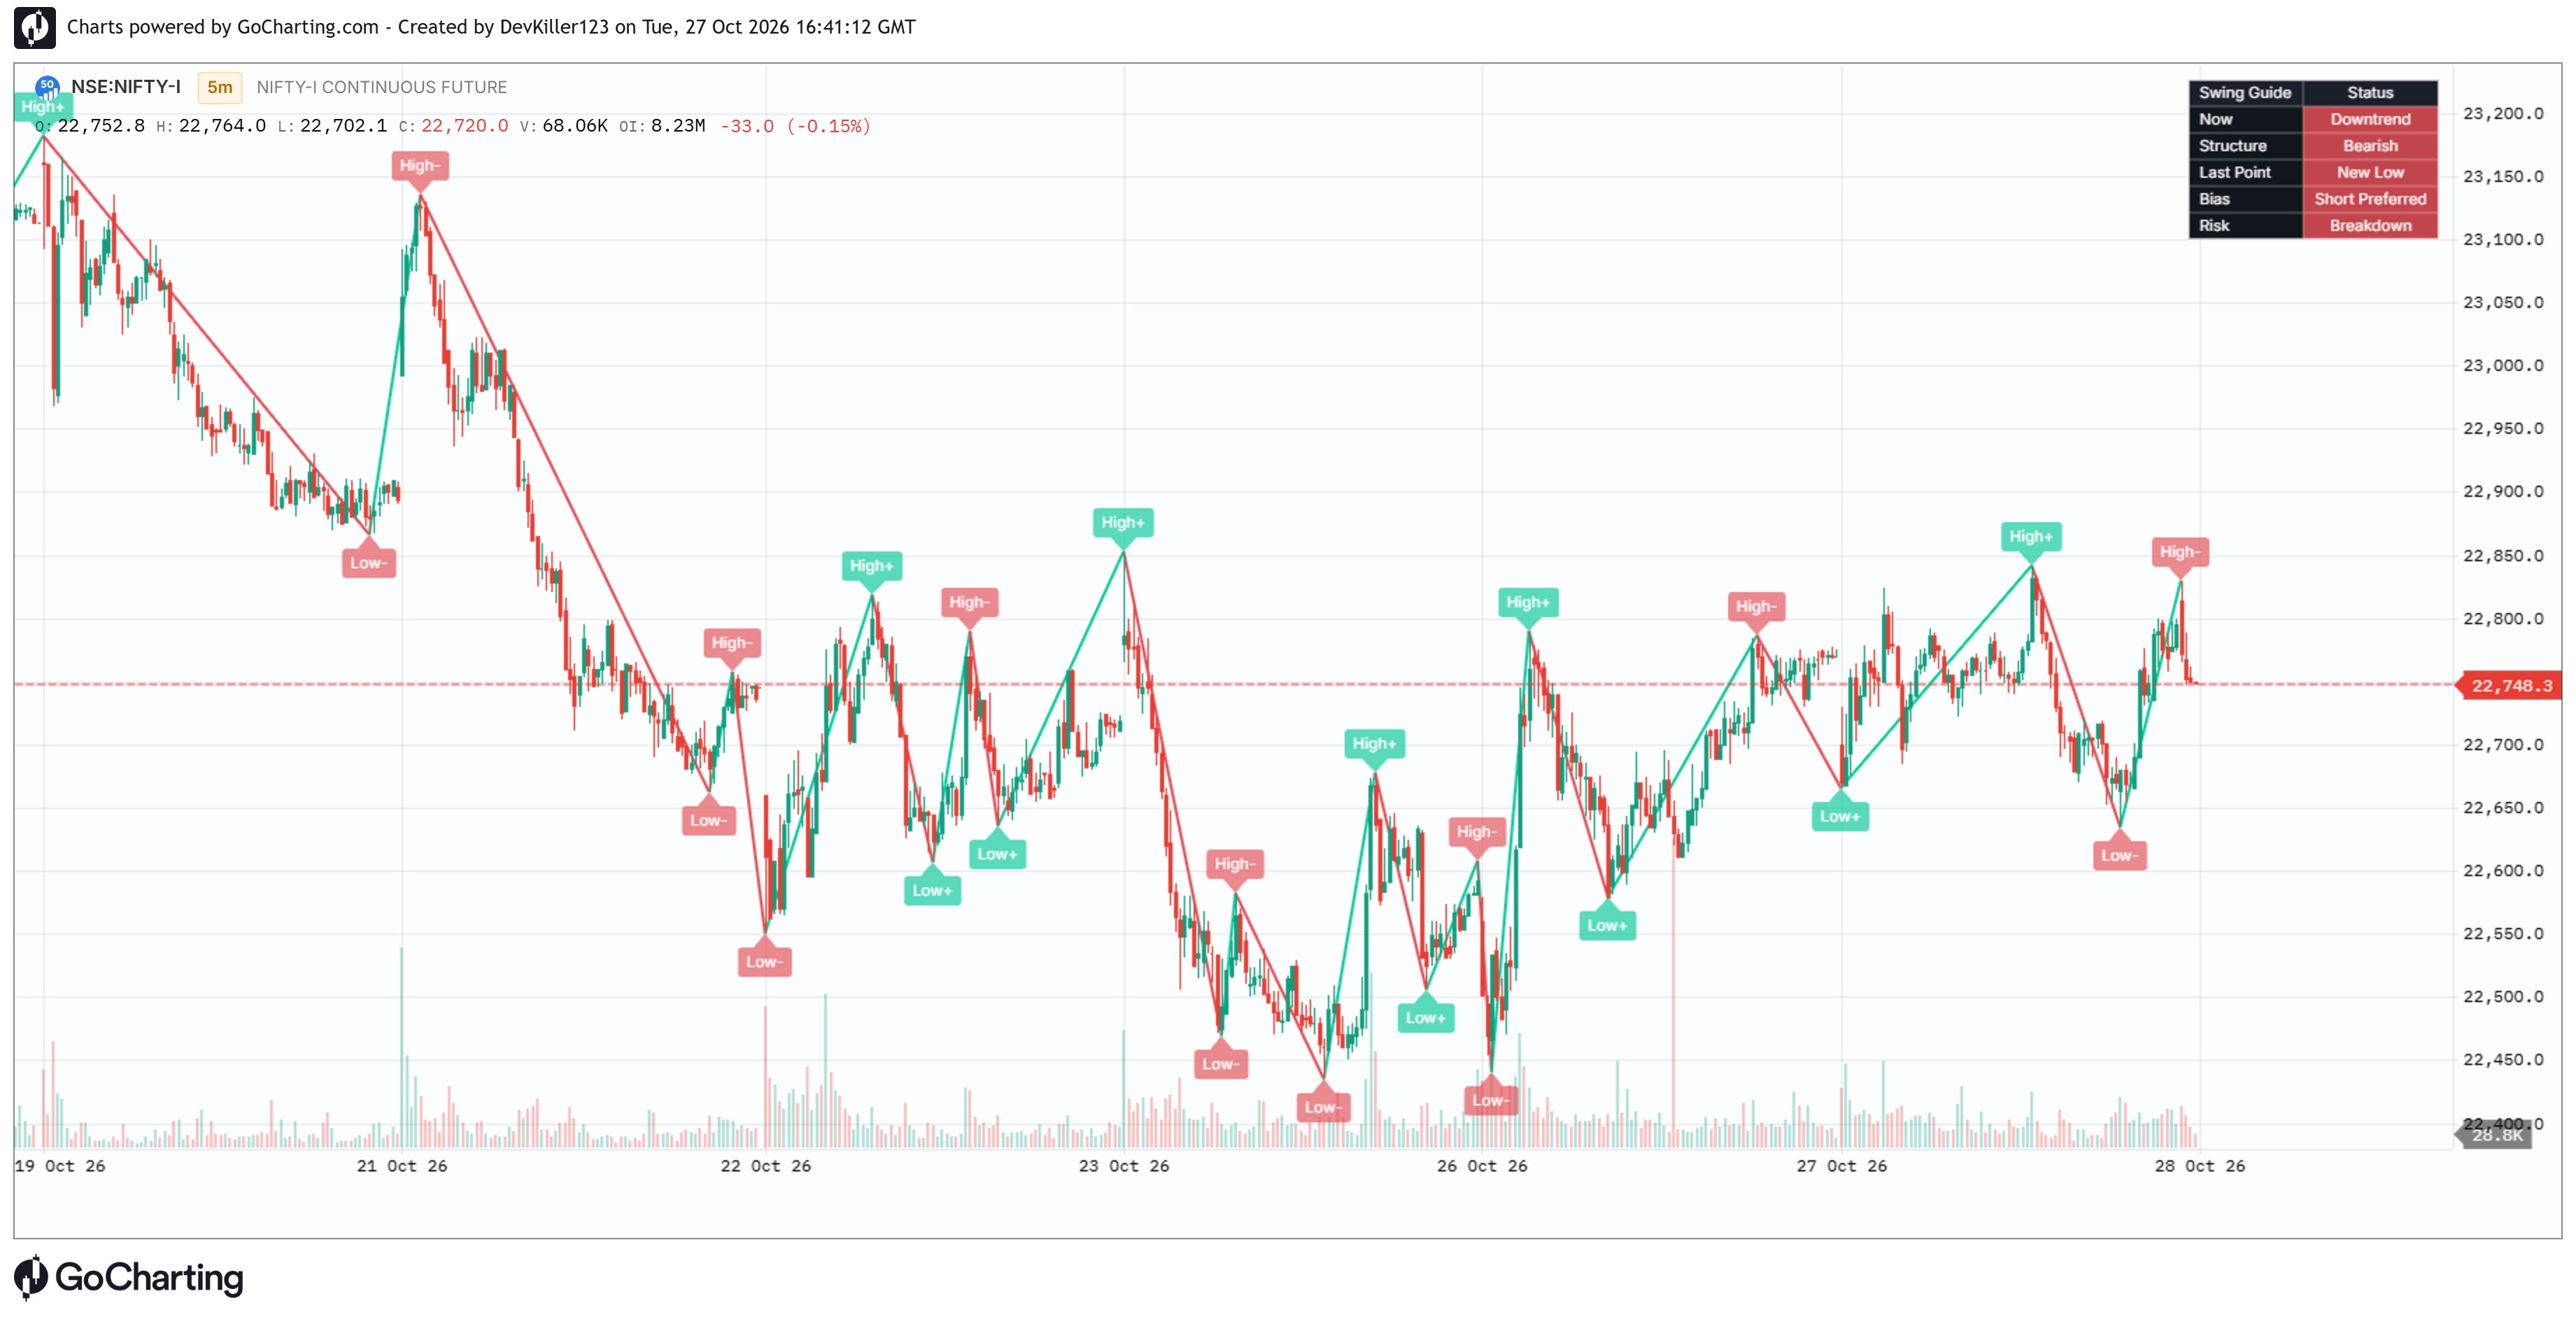
The "engulf swing HL" (GURU) indicator is a dual-purpose technical analysis tool designed for TradingView (Pine Script v6). It combines candlestick pattern recognition (Engulfing patterns) with dynamic market structure mapping (Swing highs/lows) to help traders identify trend direction, structural shifts, and potential entry signals. It overlays directly on the main price chart and features a real-time dynamic dashboard.
Key Features
1. Engulfing Candle Detection
Identifies momentum shifts using traditional bullish and bearish engulfing candlestick logic.
Bullish Engulfing: Plots a green triangle below the bar when a bullish candle completely engulfs the body of the previous bearish (or smaller) candle.
Bearish Engulfing: Plots a red triangle above the bar when a bearish candle completely engulfs the body of the previous bullish (or smaller) candle.
Toggleable: Can be completely hidden using the "Master Toggles" settings.
2. Dynamic Swing Guide (Market Structure)
Maps the underlying market trend by identifying significant swing highs and lows based on a customizable sensitivity input (default 12 bars).
Structure Labels: Automatically labels pivot points to track market structure:
HH (High+): Higher High
HL (Low+): Higher Low
LH (High-): Lower High
LL (Low-): Lower Low
Visual Tracking: Draws zigzag swing lines connecting confirmed pivots. Bullish structures (up legs) are colored green, while bearish structures (down legs) are colored red.
Repaint vs. Confirmed: Offers a "Repaint Forming Leg" option. When enabled, the swing line updates in real-time with current price action. When disabled, the line only draws once the swing point is firmly locked in.
3. Real-Time Market Dashboard
An interactive, color-coded on-chart table that summarizes the current market state based on the Swing Guide's calculations. It provides instant contextual analysis across five metrics:
Now: The immediate market state (e.g., Uptrend, Healthy Pullback, Downtrend, Possible Reversal).
Structure: Overall structural bias (Bullish, Bearish, Bullish Shift, Bearish Shift).
Last Point: The most recently confirmed swing pivot (e.g., New High, Lower Low).
Bias: Actionable directional preference (Long Preferred, Short Preferred, Wait).
Risk: Contextual risk level for current setups (e.g., Trend Extension, Pullback Zone, Breakdown).
4. Comprehensive Alerts
The script includes built-in alert conditions for automated trading or notifications:
Bullish or Bearish Engulfing candles.
Formation of specific new swing points (Higher High, Lower High, Higher Low, Lower Low).
Swing direction changes.
Major structural shifts (Bullish Structure / Bearish Structure).
Best Use Cases
This indicator is ideal for price action traders who rely on Market Structure (Smart Money Concepts/Dow Theory) to determine trend direction, and use Candlestick Patterns for entry confirmations. The dynamic dashboard serves as a quick-glance filter to prevent trading against the dominant structural trend.
The information and publications are not meant to be, and do not constitute, financial, investment, trading, or other types of advice or recommendations supplied or endorsed by GoCharting. Read more in the Terms of Use.
Related Scripts
Comments (0)
Loading comments…