Multi-Setup Intraday Signals

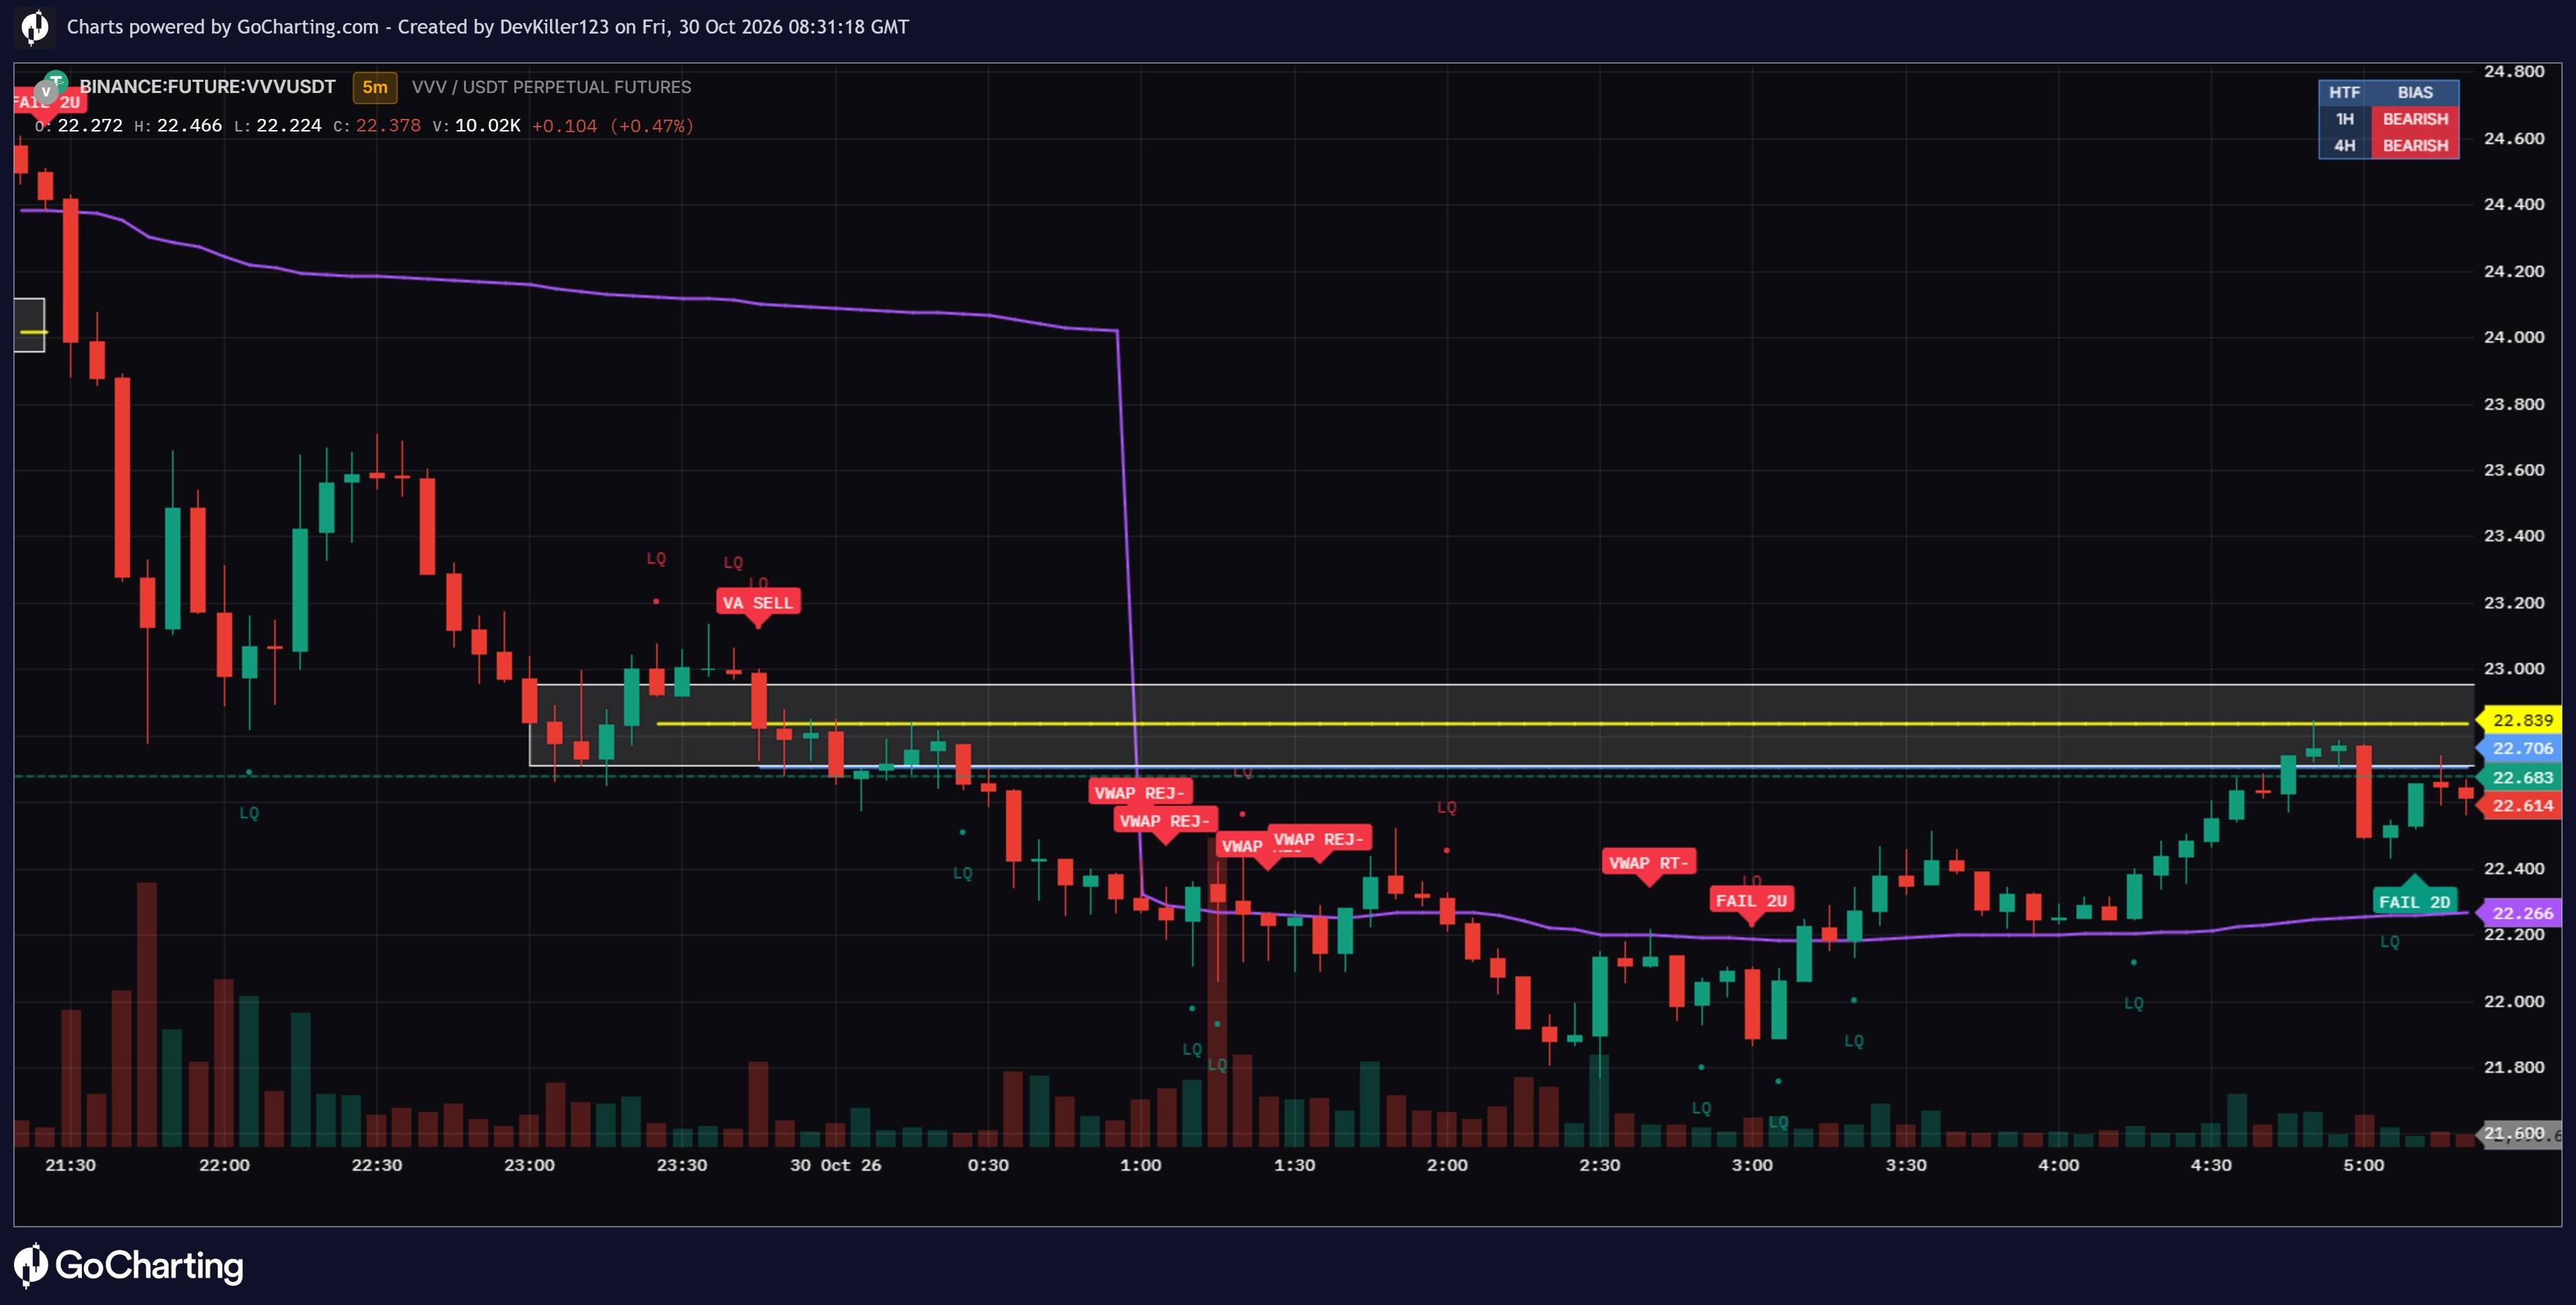
Multi-Setup Intraday Signals — script overview
This is an overlay indicator that combines higher-timeframe trend bias, supply/demand zones, session opening-profile levels, liquidity-and-structure setups, The Strat patterns, and VWAP signals. It is designed primarily for 1-minute and 5-minute charts; some features are restricted to 5-minute charts.
Higher-timeframe bias
Calculates 1-hour and 4-hour EMA bias using the fast and slow EMAs. Defaults are 20 and 50.
The Bias timeframe input chooses which timeframe filters signals: 1H by default, or 4H.
A fixed-position table shows both 1H and 4H bias as bullish, bearish, or neutral, regardless of the chart timeframe.
The bias filter is used by the script’s trade-signal conditions; it does not place orders.
30-minute and 1-hour supply/demand zones
Builds separate zones from confirmed 30-minute and 1-hour pivot highs and lows.
Zone thickness is based on that timeframe’s ATR; default thickness is 0.25 × ATR. Pivot strength defaults to 3 bars.
Each zone is drawn as its own box, extends toward the current bar, and has a label positioned at its center. Demand and supply colors/transparency are independently configurable for each timeframe.
The script keeps up to 6 zones per type and timeframe by default.
Invalidation: A zone is removed when a candle from its own timeframe closes beyond its far edge: a 30-minute close below 30-minute demand or above 30-minute supply; likewise for 1-hour zones. Wicks alone do not remove a zone.
Zone sweep + BOS retest signals
On 1-minute or 5-minute charts, tracks the latest chart-timeframe swing highs and lows.
A bullish setup begins with a sweep below a swing low that closes back above it while price overlaps a demand zone and the selected HTF bias is bullish. The bearish setup mirrors this at a supply zone and swing high.
After the sweep, the script waits for a matching break of structure (BOS), then a retest of the broken swing level that closes back on the breakout side.
The sweep-to-BOS and BOS-to-retest stages each expire after 24 chart bars by default.
Signals are labeled Z-BUY and Z-SELL; each direction has an alert condition.
Session opening volume profile
Runs on 5-minute charts for three session windows in the selected timezone, defaulting to America/Chicago:
New York: 08:30–15:30
Asia: 17:00–02:00
London: 02:00–08:30
Uses the first 6 five-minute bars of each session to estimate the opening POC, VAH, and VAL.
Displays the VAH–VAL value-area box through the session and a yellow POC line by default.
Offers 5-minute, HTF-bias-filtered signals for a VAH/VAL breakout retest or a move back inside value after an excursion outside it. These are labeled VA BUY and VA SELL, with alert conditions.
A blue target line is plotted for the relevant value-area boundary after a re-entry signal.
Liquidity + The Strat confluence
Identifies liquidity grabs when price sweeps the latest chart-timeframe swing high or low and closes back across it. Optional LQ markers show these events.
On 1-minute or 5-minute charts, looks for these patterns within 8 bars of a grab by default:
2-1-2: directional bar, inside bar, then a same-direction 2 bar.
3-1-2: outside bar, inside bar, then a directional 2 bar.
Failed 2: a 2-up or 2-down fails through its opposite side.
Requires the selected HTF bias to agree with the signal direction. Signals are labeled by pattern, with bullish and bearish alert conditions.
VWAP signals
Plots a purple session VWAP calculated from hlc3.
On 5-minute charts, can signal an HTF-aligned break-and-retest of VWAP within 12 bars by default.
Also detects directional VWAP rejections: price tests VWAP and closes back on its prior side with a candle body in that direction.
Signals are labeled VWAP RT+/- or VWAP REJ+/-; each has an alert condition.
Notes
The opening profile is an OHLCV-based estimate, not a tick-by-tick volume profile. It allocates each opening candle’s volume across price bins according to the candle’s range.
Pivot zones appear only after their pivots are confirmed, so they are identified with a delay determined by the pivot-strength setting.
Signal conditions generally require a confirmed chart candle; the script is an indicator, not an automated strategy.
The information and publications are not meant to be, and do not constitute, financial, investment, trading, or other types of advice or recommendations supplied or endorsed by GoCharting. Read more in the Terms of Use.
Related Scripts
Comments (0)
Loading comments…