Value Enjoyer
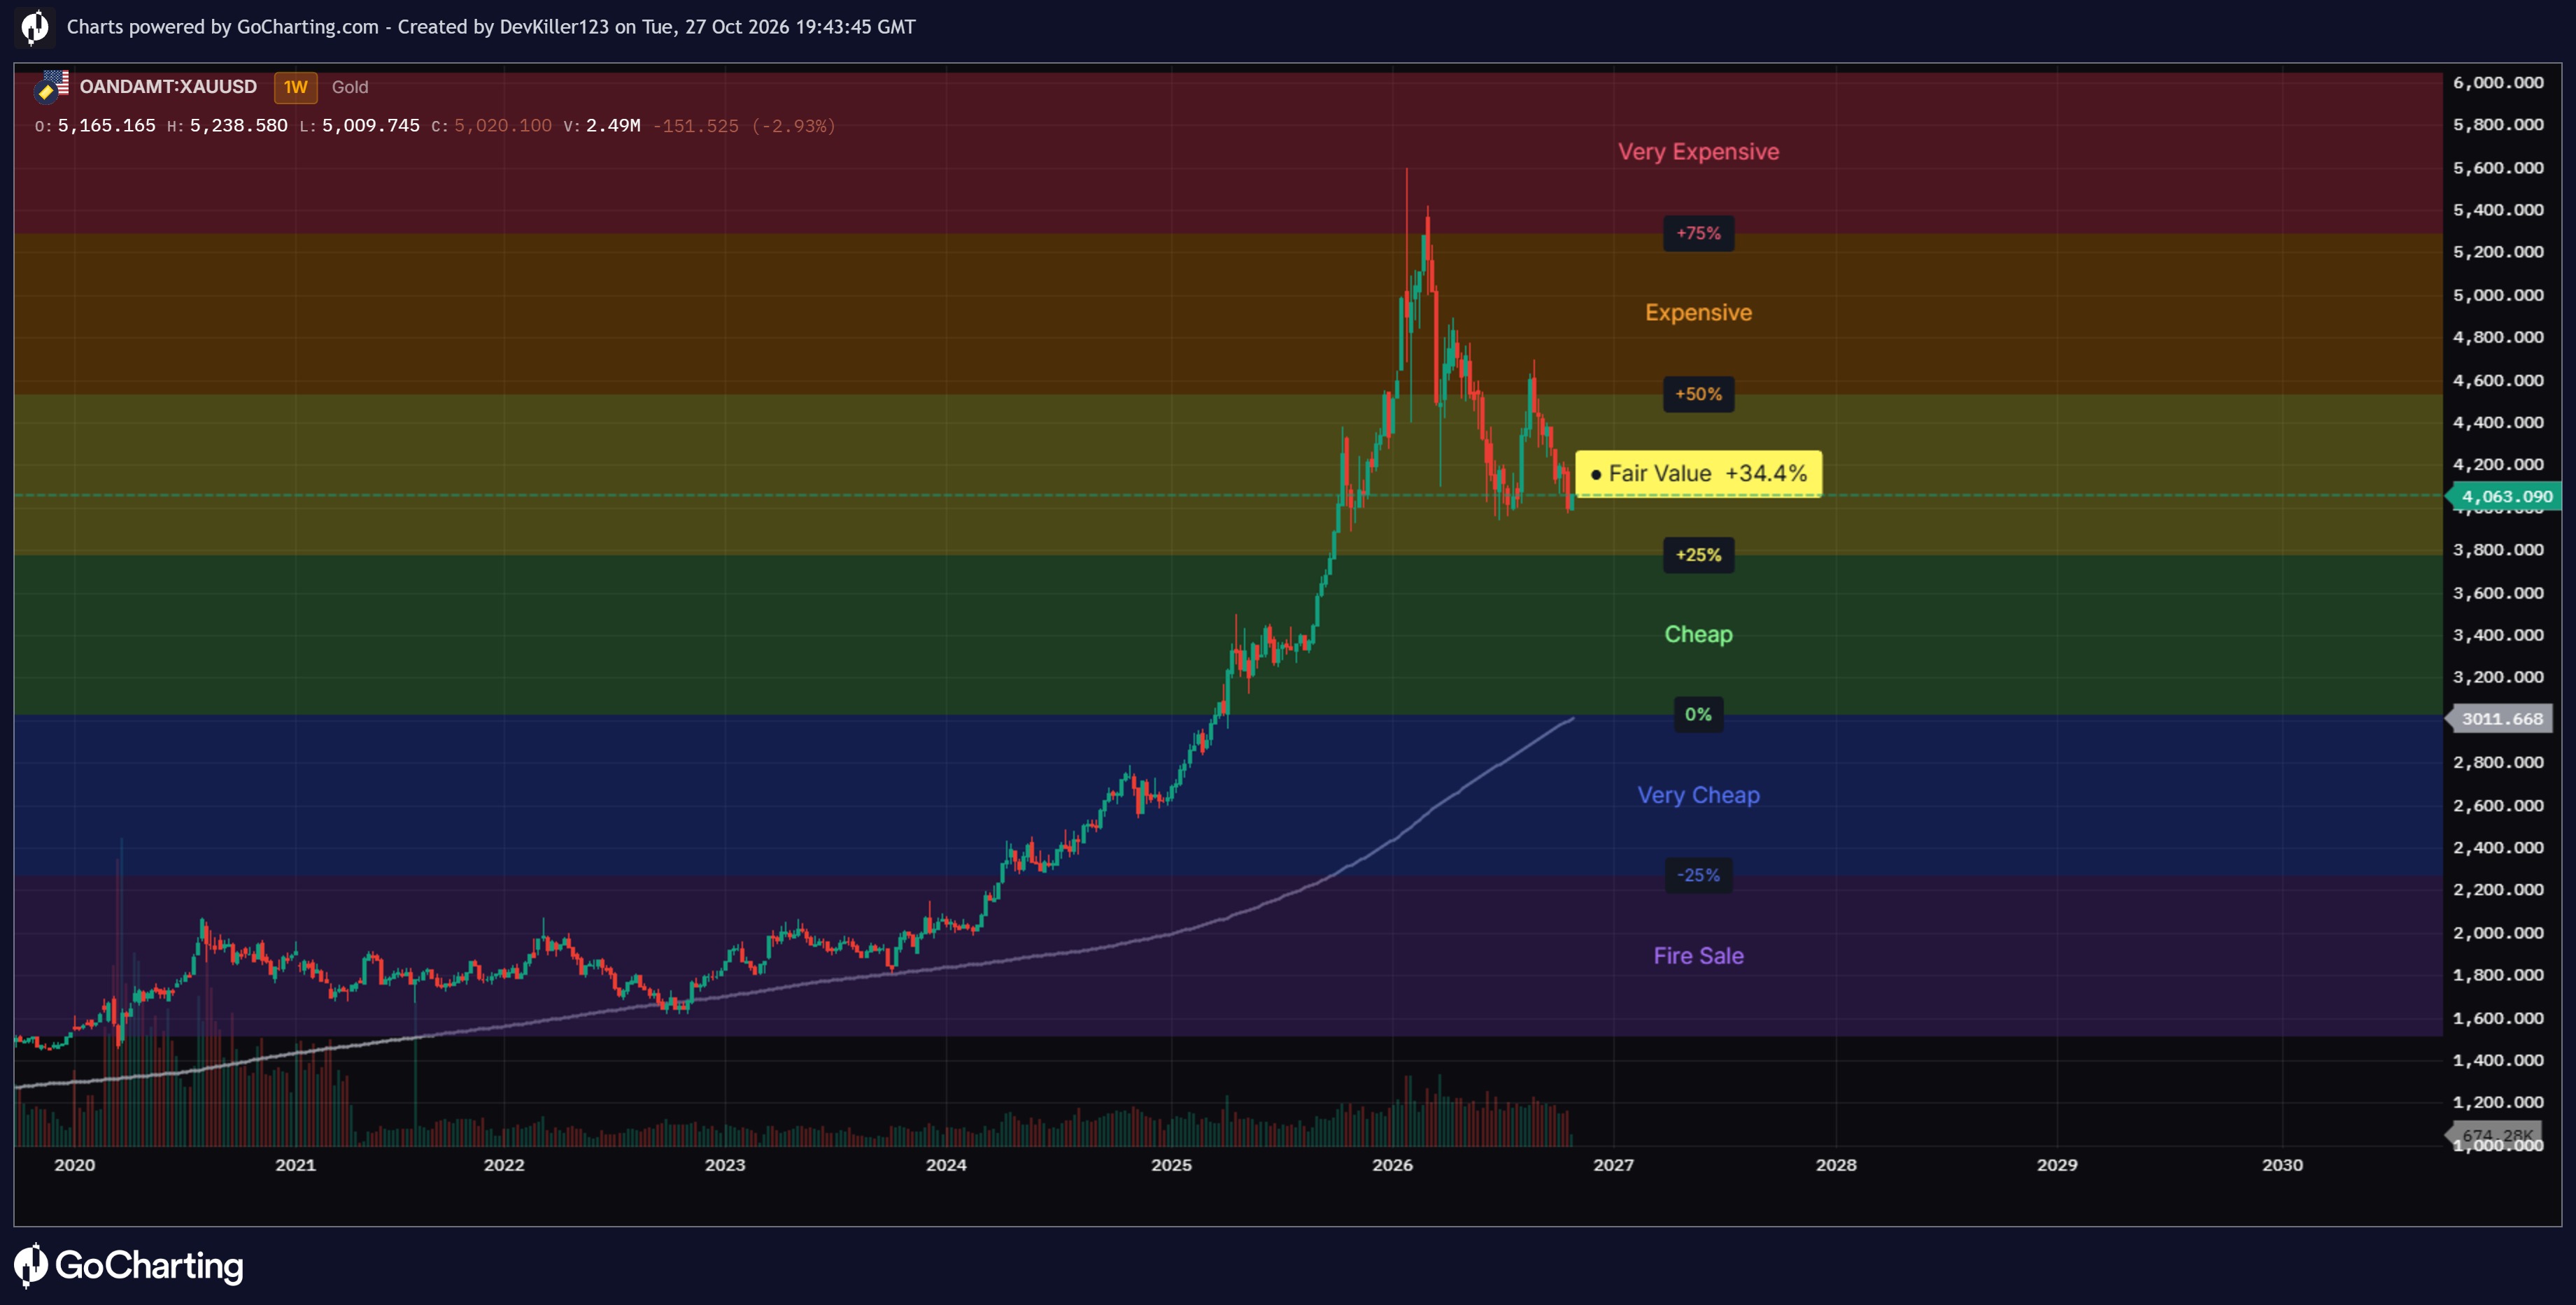
alue Enjoyer shows how cheap or expensive an asset is based on its distance from a long-term moving average. By default that’s the 200-week SMA.
Price is placed into one of six zones, from Fire Sale to Very Expensive, based on how far it sits above or below the MA. The zone it’s in right now is highlighted on the right, along with its exact distance from the MA.
HOW IT WORKS
Each zone boundary is a percentage above or below the MA. With the defaults, on a weekly chart:
Fire Sale: more than 25% below the 200W MA
Very Cheap: 0% to 25% below
Cheap: 0% to 25% above
Fair Value: 25% to 50% above
Expensive: 50% to 75% above
Very Expensive: more than 75% above
Different assets behave differently. Bitcoin regularly trades below its 200W MA; stock indexes and gold rarely do. Set the five boundaries to fit the asset you’re looking at.
VIEWS
Current: today’s zones drawn across the whole chart, for a quick read on where price sits now.
Historical: the zones move with the MA through time, so you can see which zone price was in at any point in the past. Hover any candle to read that date’s zone prices in the status line.
SETTINGS
Length: the MA length, using the chart’s timeframe. 200 on a weekly chart is the 200W MA; 200 on a daily chart is the 200D MA.
Zone boundaries: where each zone starts, as % from the MA.
Zone colors: labels and boundary lines follow these colors automatically.
Label position: how far past the last candle the labels sit.
Chart price scale: set to Log if your chart uses a log scale, so labels sit in the middle of each zone.
ALERTS
Create an alert, choose Value Enjoyer, and pick “Any alert() function call” to be notified whenever price moves into a new zone. The message names the zone and the distance from the MA. Alerts trigger as soon as price crosses a boundary, not only at the candle close. If you change your settings later, recreate the alert so it uses the new levels.
This indicator is a visual tool for context. It doesn’t predict price and isn’t financial advice.
The information and publications are not meant to be, and do not constitute, financial, investment, trading, or other types of advice or recommendations supplied or endorsed by GoCharting. Read more in the Terms of Use.
Related Scripts
Comments (1)
Loading comments…