Cedric | Support & Resistance Zones V1.7

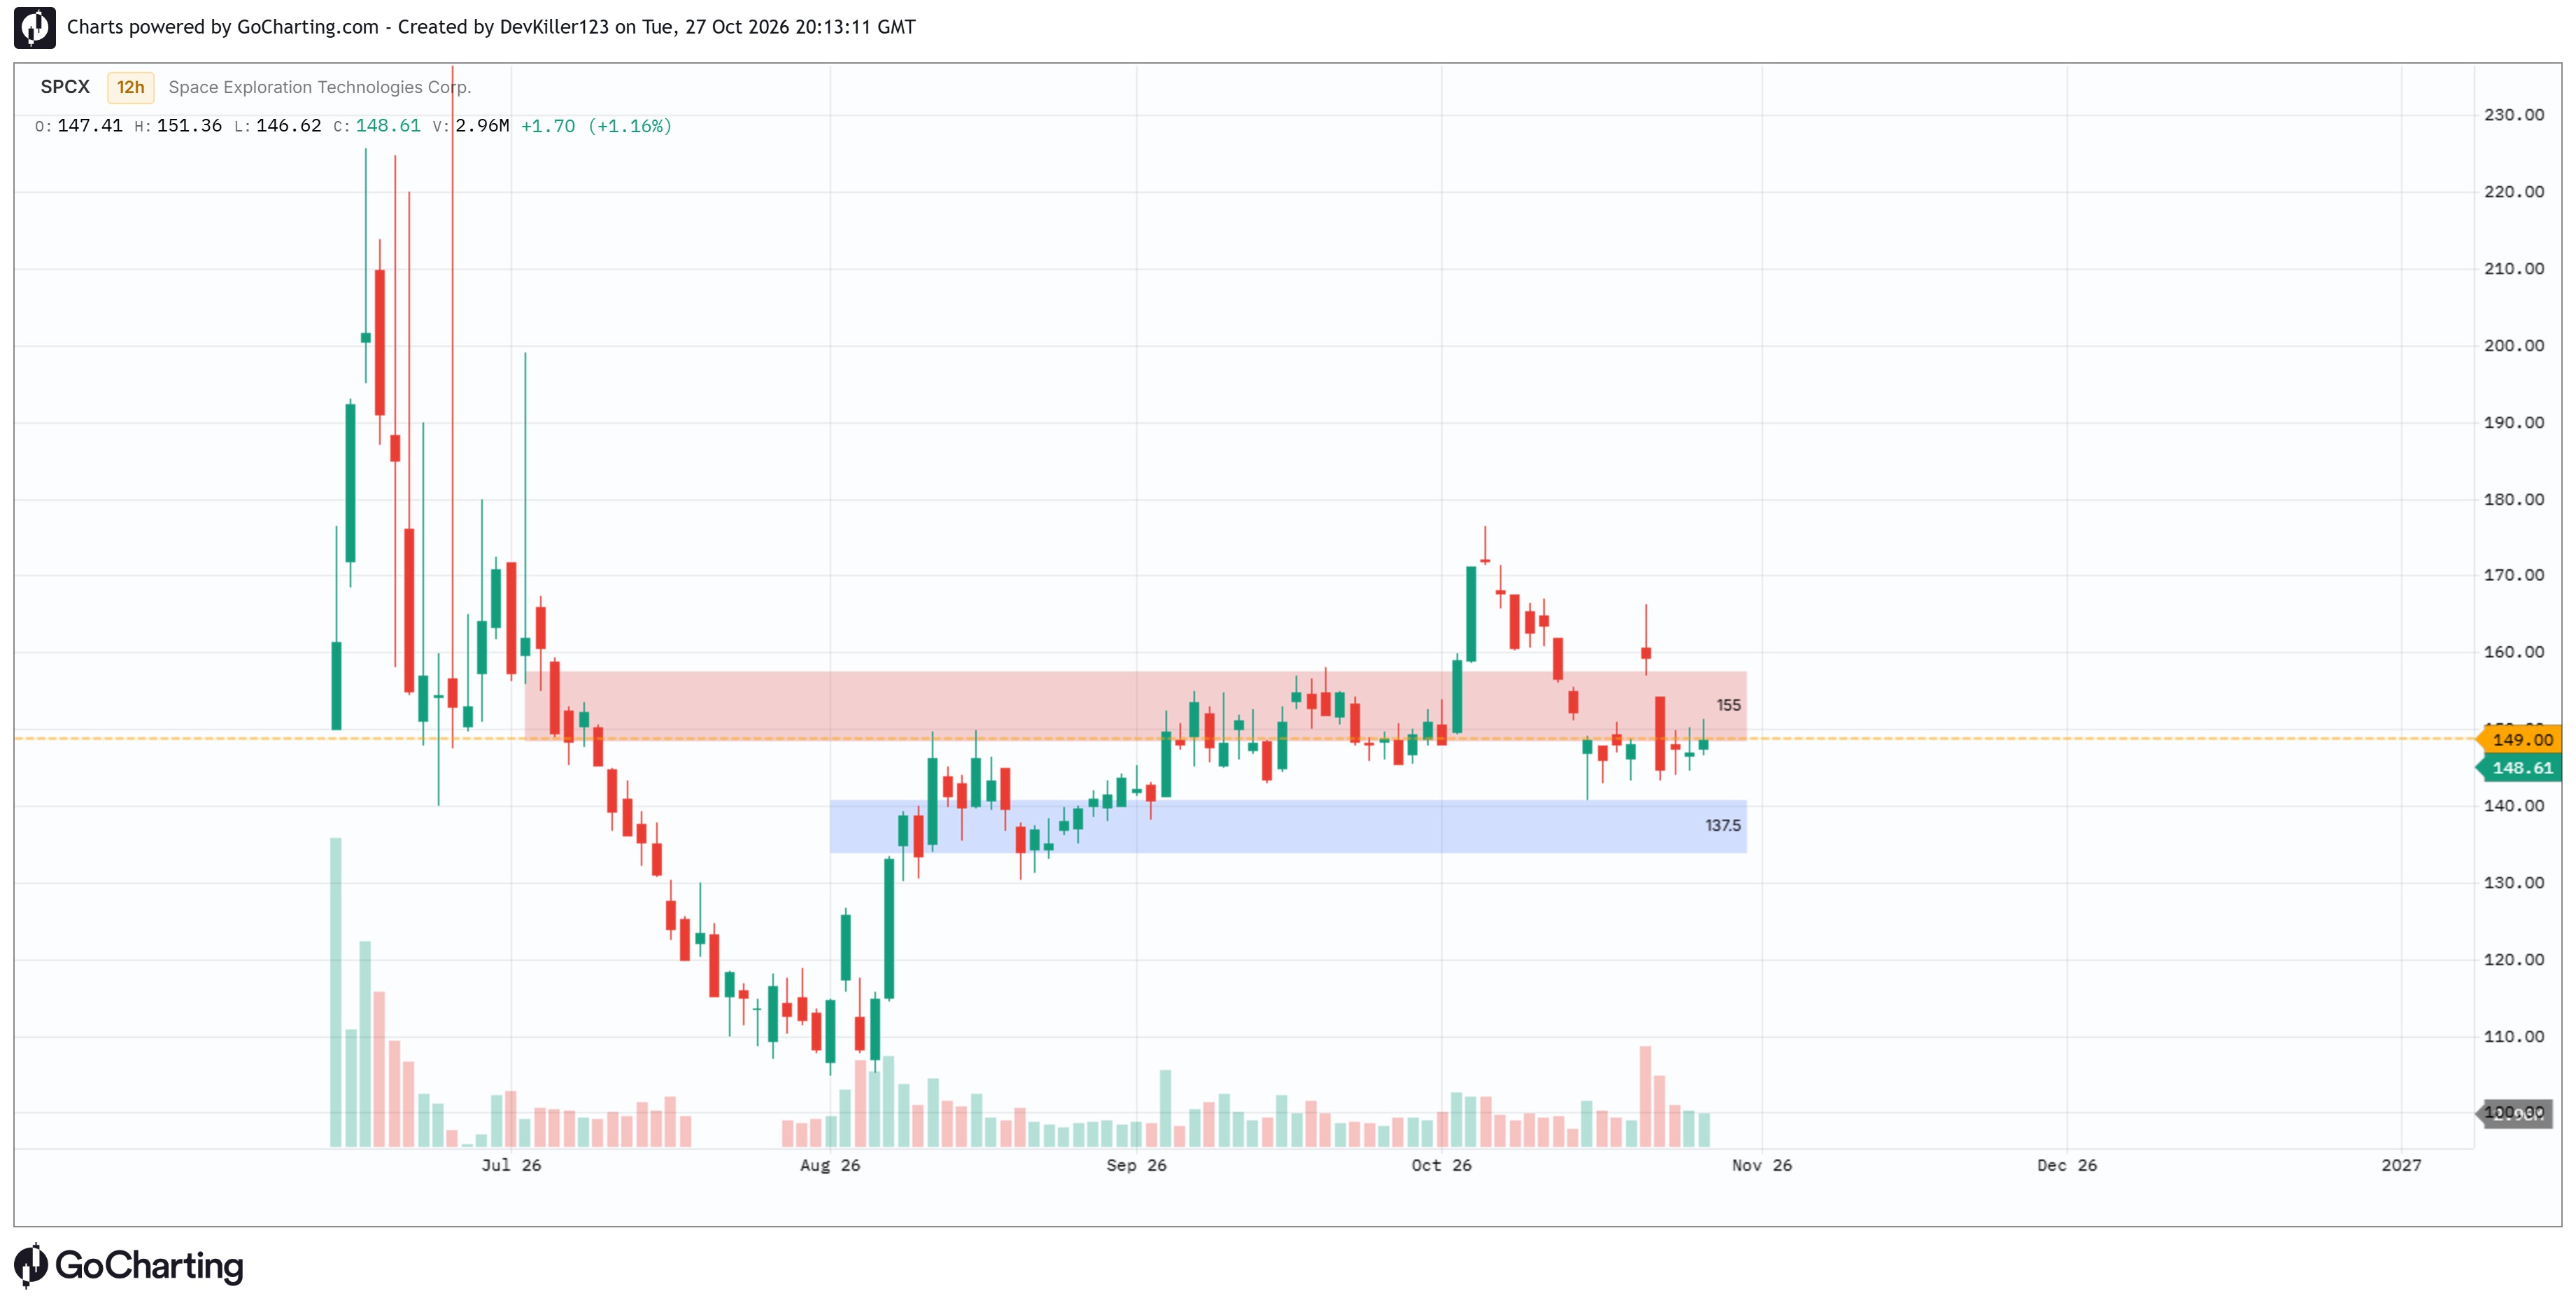
I spend a lot of time manually identifying support and resistance zones on my charts. I wanted an indicator that could automate that process without filling the screen with dozens of unnecessary levels.
That's why I built Dynamic Support & Resistance Zones.
The indicator identifies significant historical swing points, groups nearby price reactions into zones, and prioritizes areas that have remained relevant to recent price action.
HOW IT WORKS
Rather than drawing a horizontal line at every swing high or low, the indicator looks for areas where price has repeatedly reacted.
Its ranking system places particular emphasis on recent, independent swing reactions. This helps prevent older levels from dominating the chart simply because they appeared frequently in the distant past.
The result is a selection of support and resistance zones that can adapt as new price action develops.
KEY FEATURES
✅ Automatic support and resistance zone detection
✅ Recent price reactions receive greater importance
✅ Nearby swing points are grouped into zones
✅ Adjustable historical lookback
✅ Customizable zone width and number of displayed zones
✅ Adaptive price labels for cleaner, more recognizable levels
✅ Designed to work across different markets and price ranges
CUSTOMIZATION
There isn't one perfect way to draw support and resistance.
Some traders prefer a handful of major zones. Others want more detail. The indicator allows you to adjust its settings to suit your approach.
You can increase the historical lookback to identify older structures, reduce the number of displayed zones for a cleaner chart, or adjust zone width to suit your preference.
The rounded price labels are purely visual and do not change the underlying boundaries of the detected zones.
HOW TO USE IT
Use the highlighted zones to identify areas where price may encounter buying or selling interest.
They can help you plan potential reactions, breakouts, retests, and invalidation levels.
The indicator is intended to support your own technical analysis rather than replace it.
IMPORTANT LIMITATIONS
Zones are based on confirmed historical swing points, so new zones are identified with a delay. As new price action develops, the selection and ranking of displayed zones may change.
Not every zone will produce a reaction, and historical significance does not guarantee future support or resistance.
The indicator is a tool for identifying areas worth watching, not a buy or sell signal.
2 days ago
Release Notes
Added separate color settings for support and resistance zones.
Zones above the current price are displayed in red by default.
Zones below the current price remain blue.
Both colors can be customized independently.
Zone colors automatically update as price moves above or below them.
No changes to the zone detection algorithm or existing settings.
2 days ago
Release Notes
Added new customization options for the text displayed inside support and resistance zones.
- Choose any text color.
- Adjust text size (Tiny, Small, Normal, Large).
- Change text alignment (Left, Center, Right).
- Switch between price-only labels and Support/Resistance + Price.
- Show or hide zone labels entirely.
- Labels automatically update when zones switch between support and resistance.
All existing zone detection and ranking logic remains unchanged.
The information and publications are not meant to be, and do not constitute, financial, investment, trading, or other types of advice or recommendations supplied or endorsed by GoCharting. Read more in the Terms of Use.
Related Scripts
Comments (0)
Loading comments…