A.I Fibonacci [Paradox]

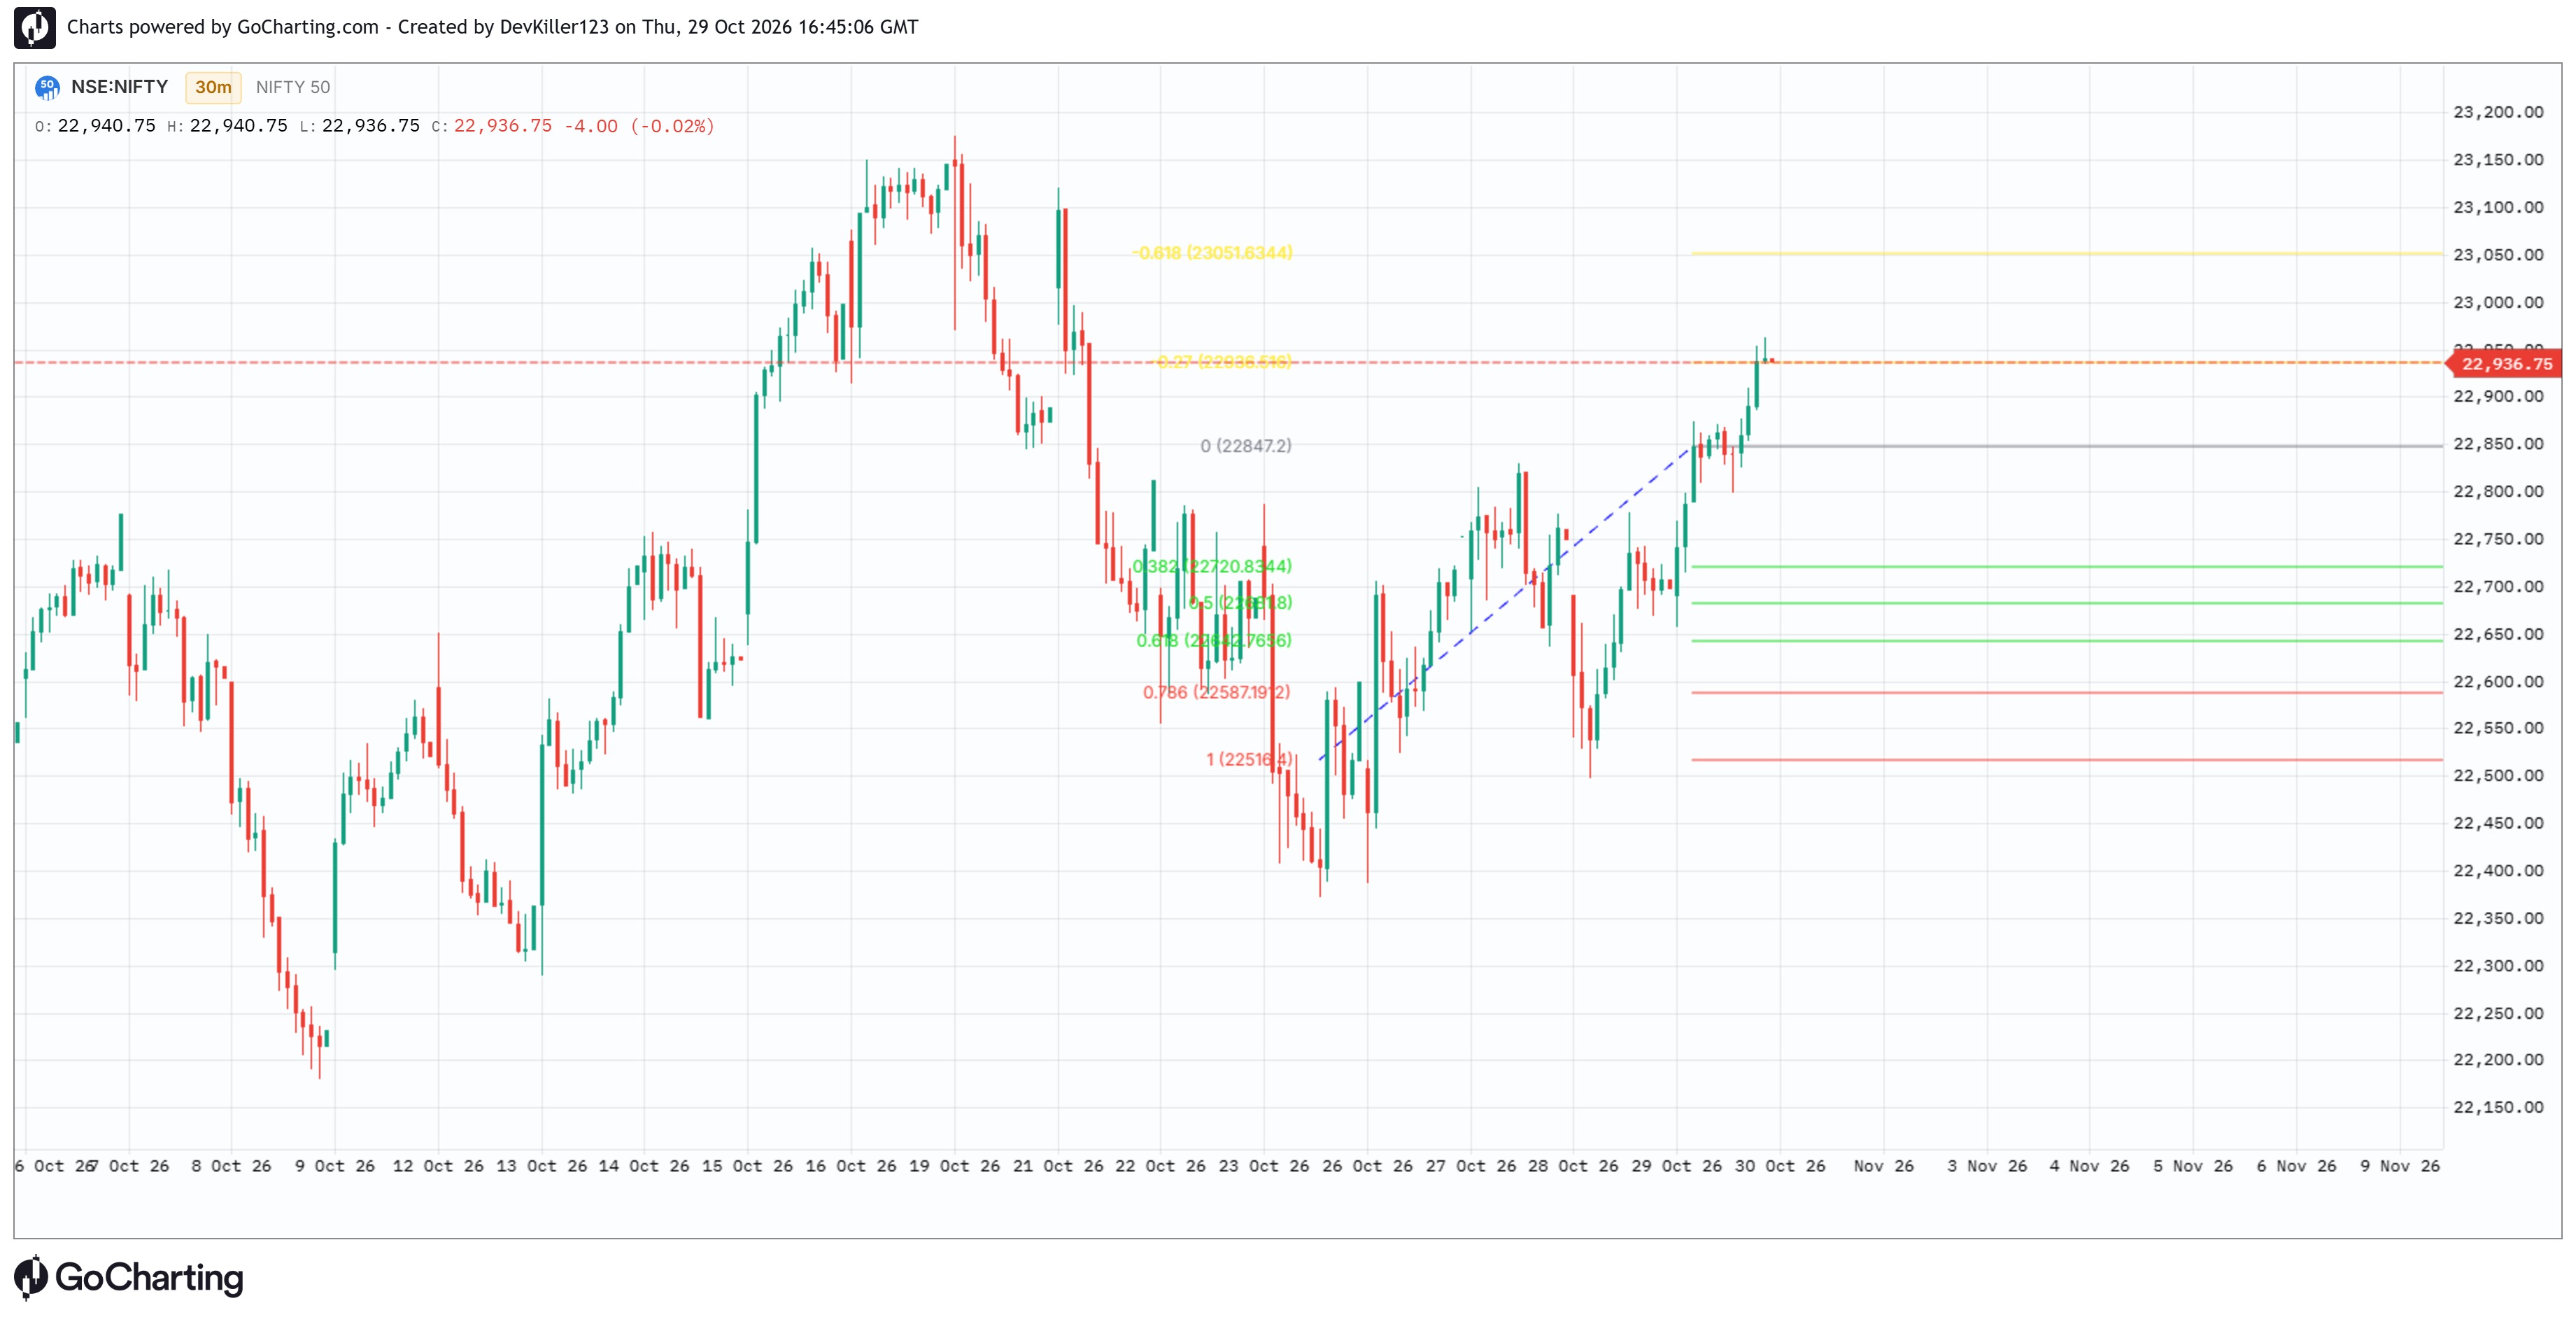
This indicator identifies swing highs and lows using a pivot window derived from Depth, then filters alternating pivots by their price change relative to a 10-bar ATR and the Deviation setting. It draws a dashed line between accepted pivots and updates horizontal Fibonacci levels from the latest swing, extending them to the right. Choose whether to invert the swing, show level values or percentages and prices, and independently enable, set and color levels from 0 through extensions. It does not place trades or generate alerts.
The information and publications are not meant to be, and do not constitute, financial, investment, trading, or other types of advice or recommendations supplied or endorsed by GoCharting. Read more in the Terms of Use.
Related Scripts
Comments (0)
Loading comments…