VWAP Range Breakout
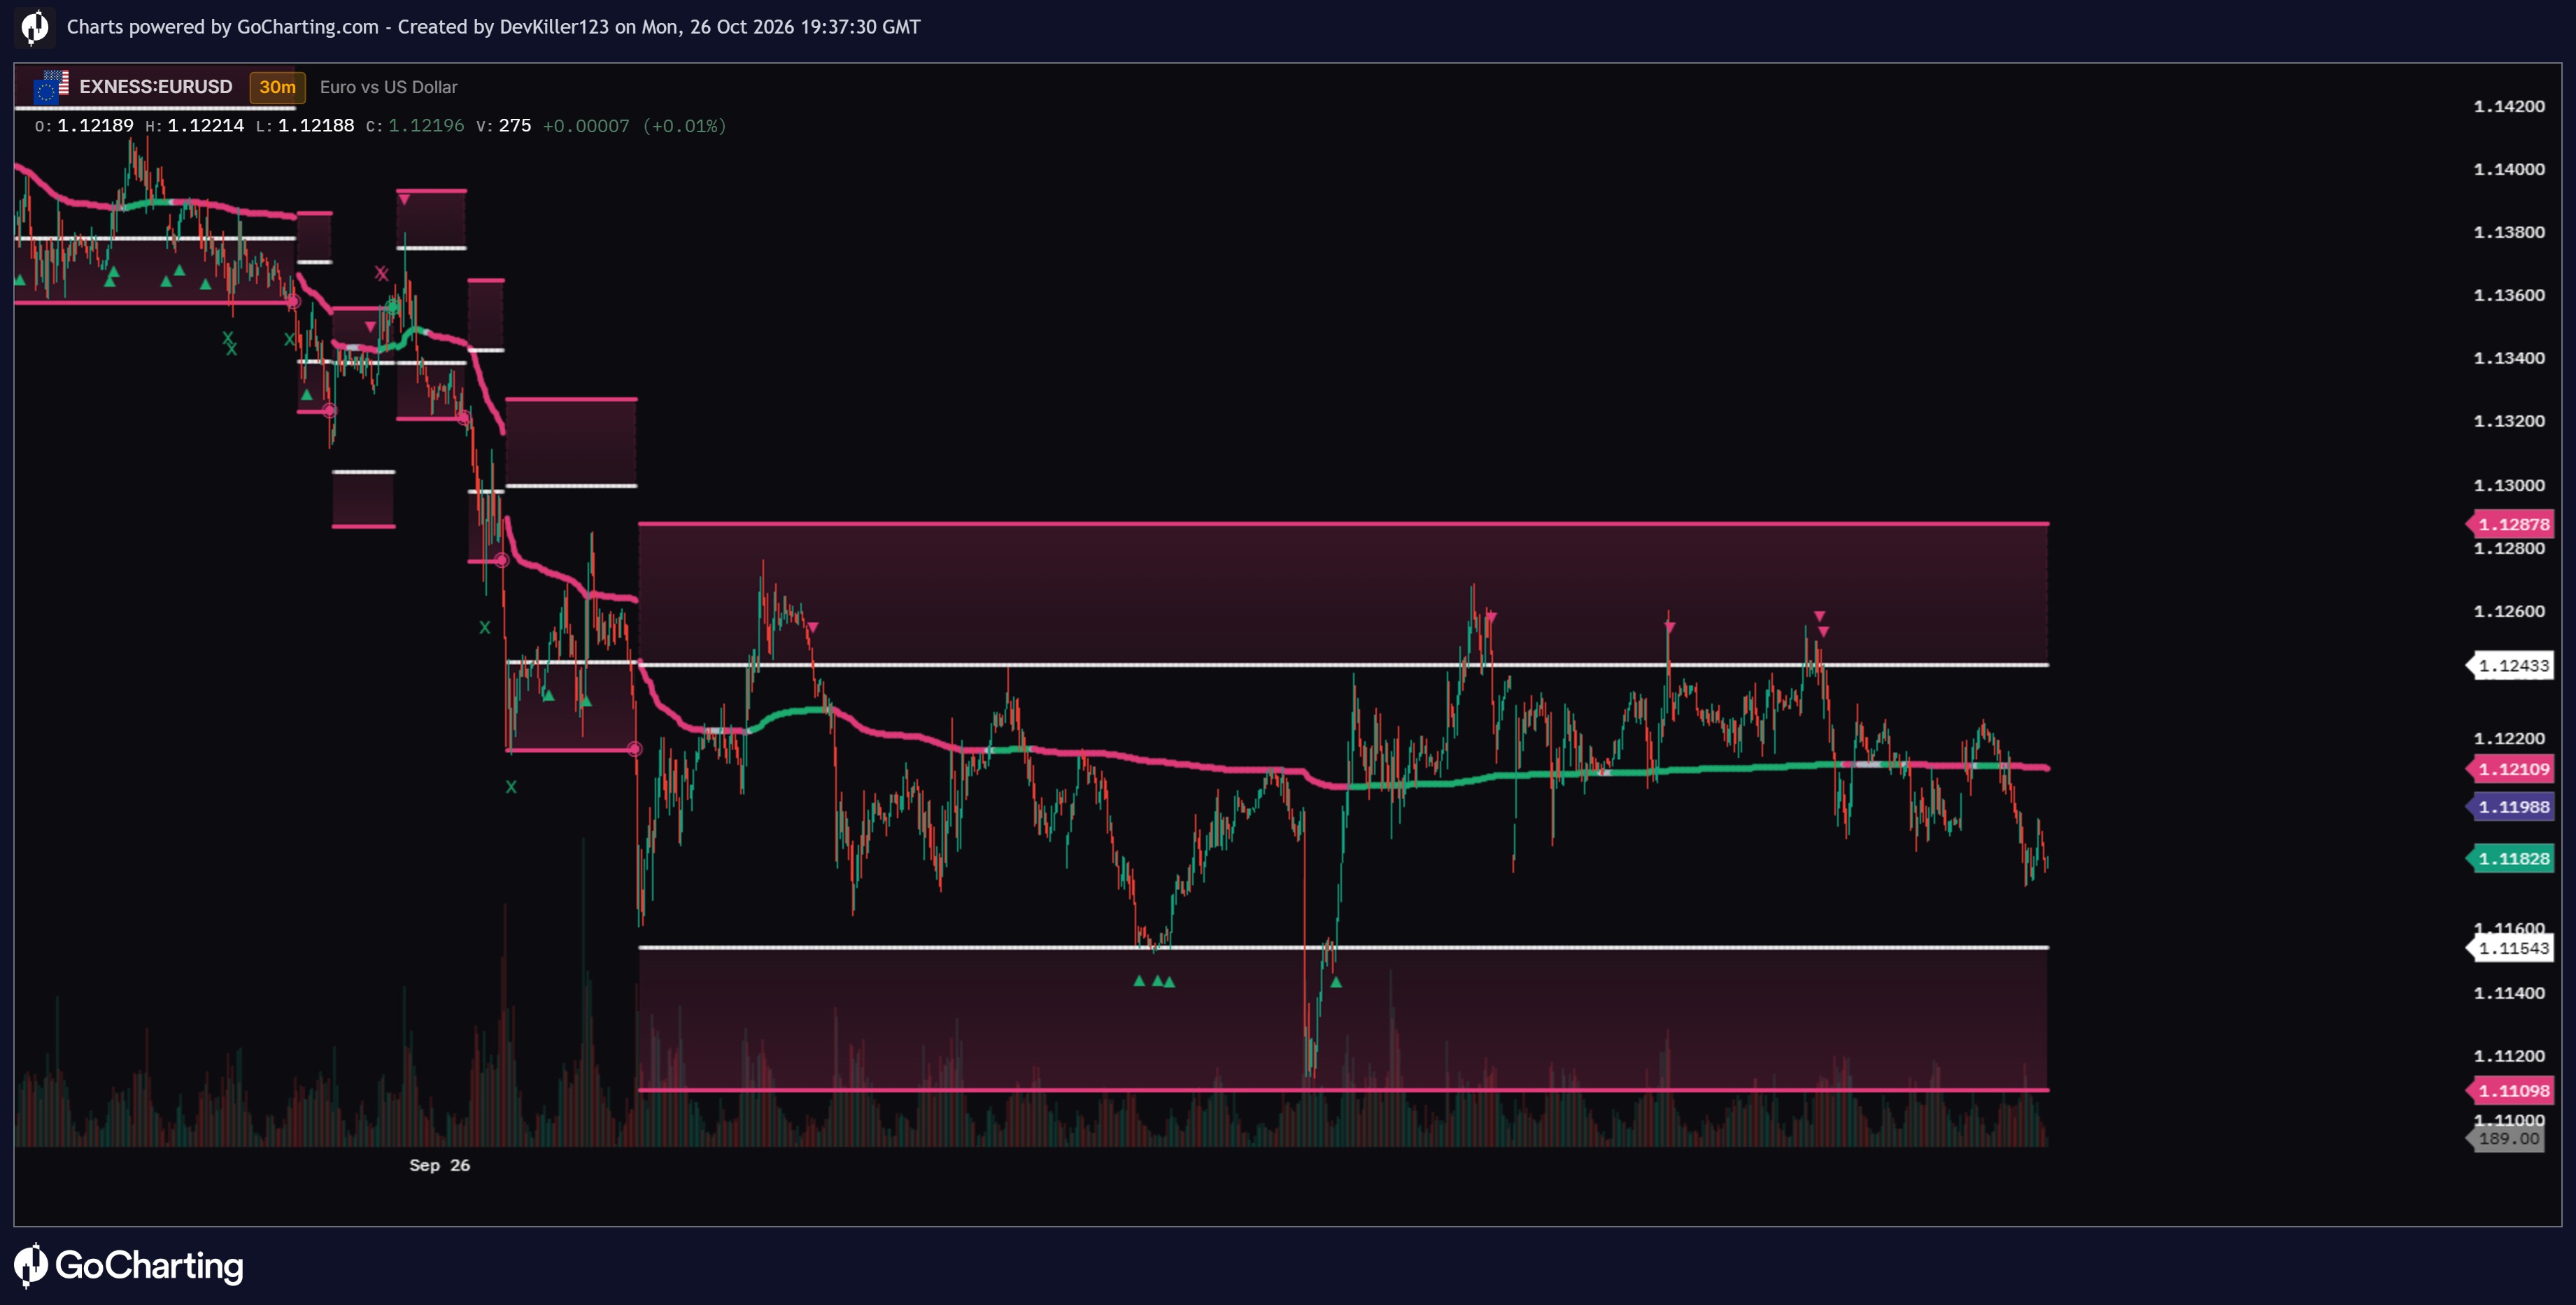
Range coloring identifies the directional environment at the time of formation:
• Bullish Range = both upper and lower zones use the selected bullish color
• Bearish Range = both zones use the selected bearish color
• Neutral Range = upper and lower zones use independently selected colors
The range colors are locked at formation. Even if market conditions change while price remains inside the same range, the original classification and colors remain unchanged.
The indicator also identifies price reactions at the range boundaries:
• ▲ Bullish Arrow = recovery through the lower internal boundary
• ▼ Bearish Arrow = rejection through the upper internal boundary
• ◉ Breakout Circle = confirmed breakout beyond the outer range boundary
• X Marker = price returning through an outer boundary after an excursion
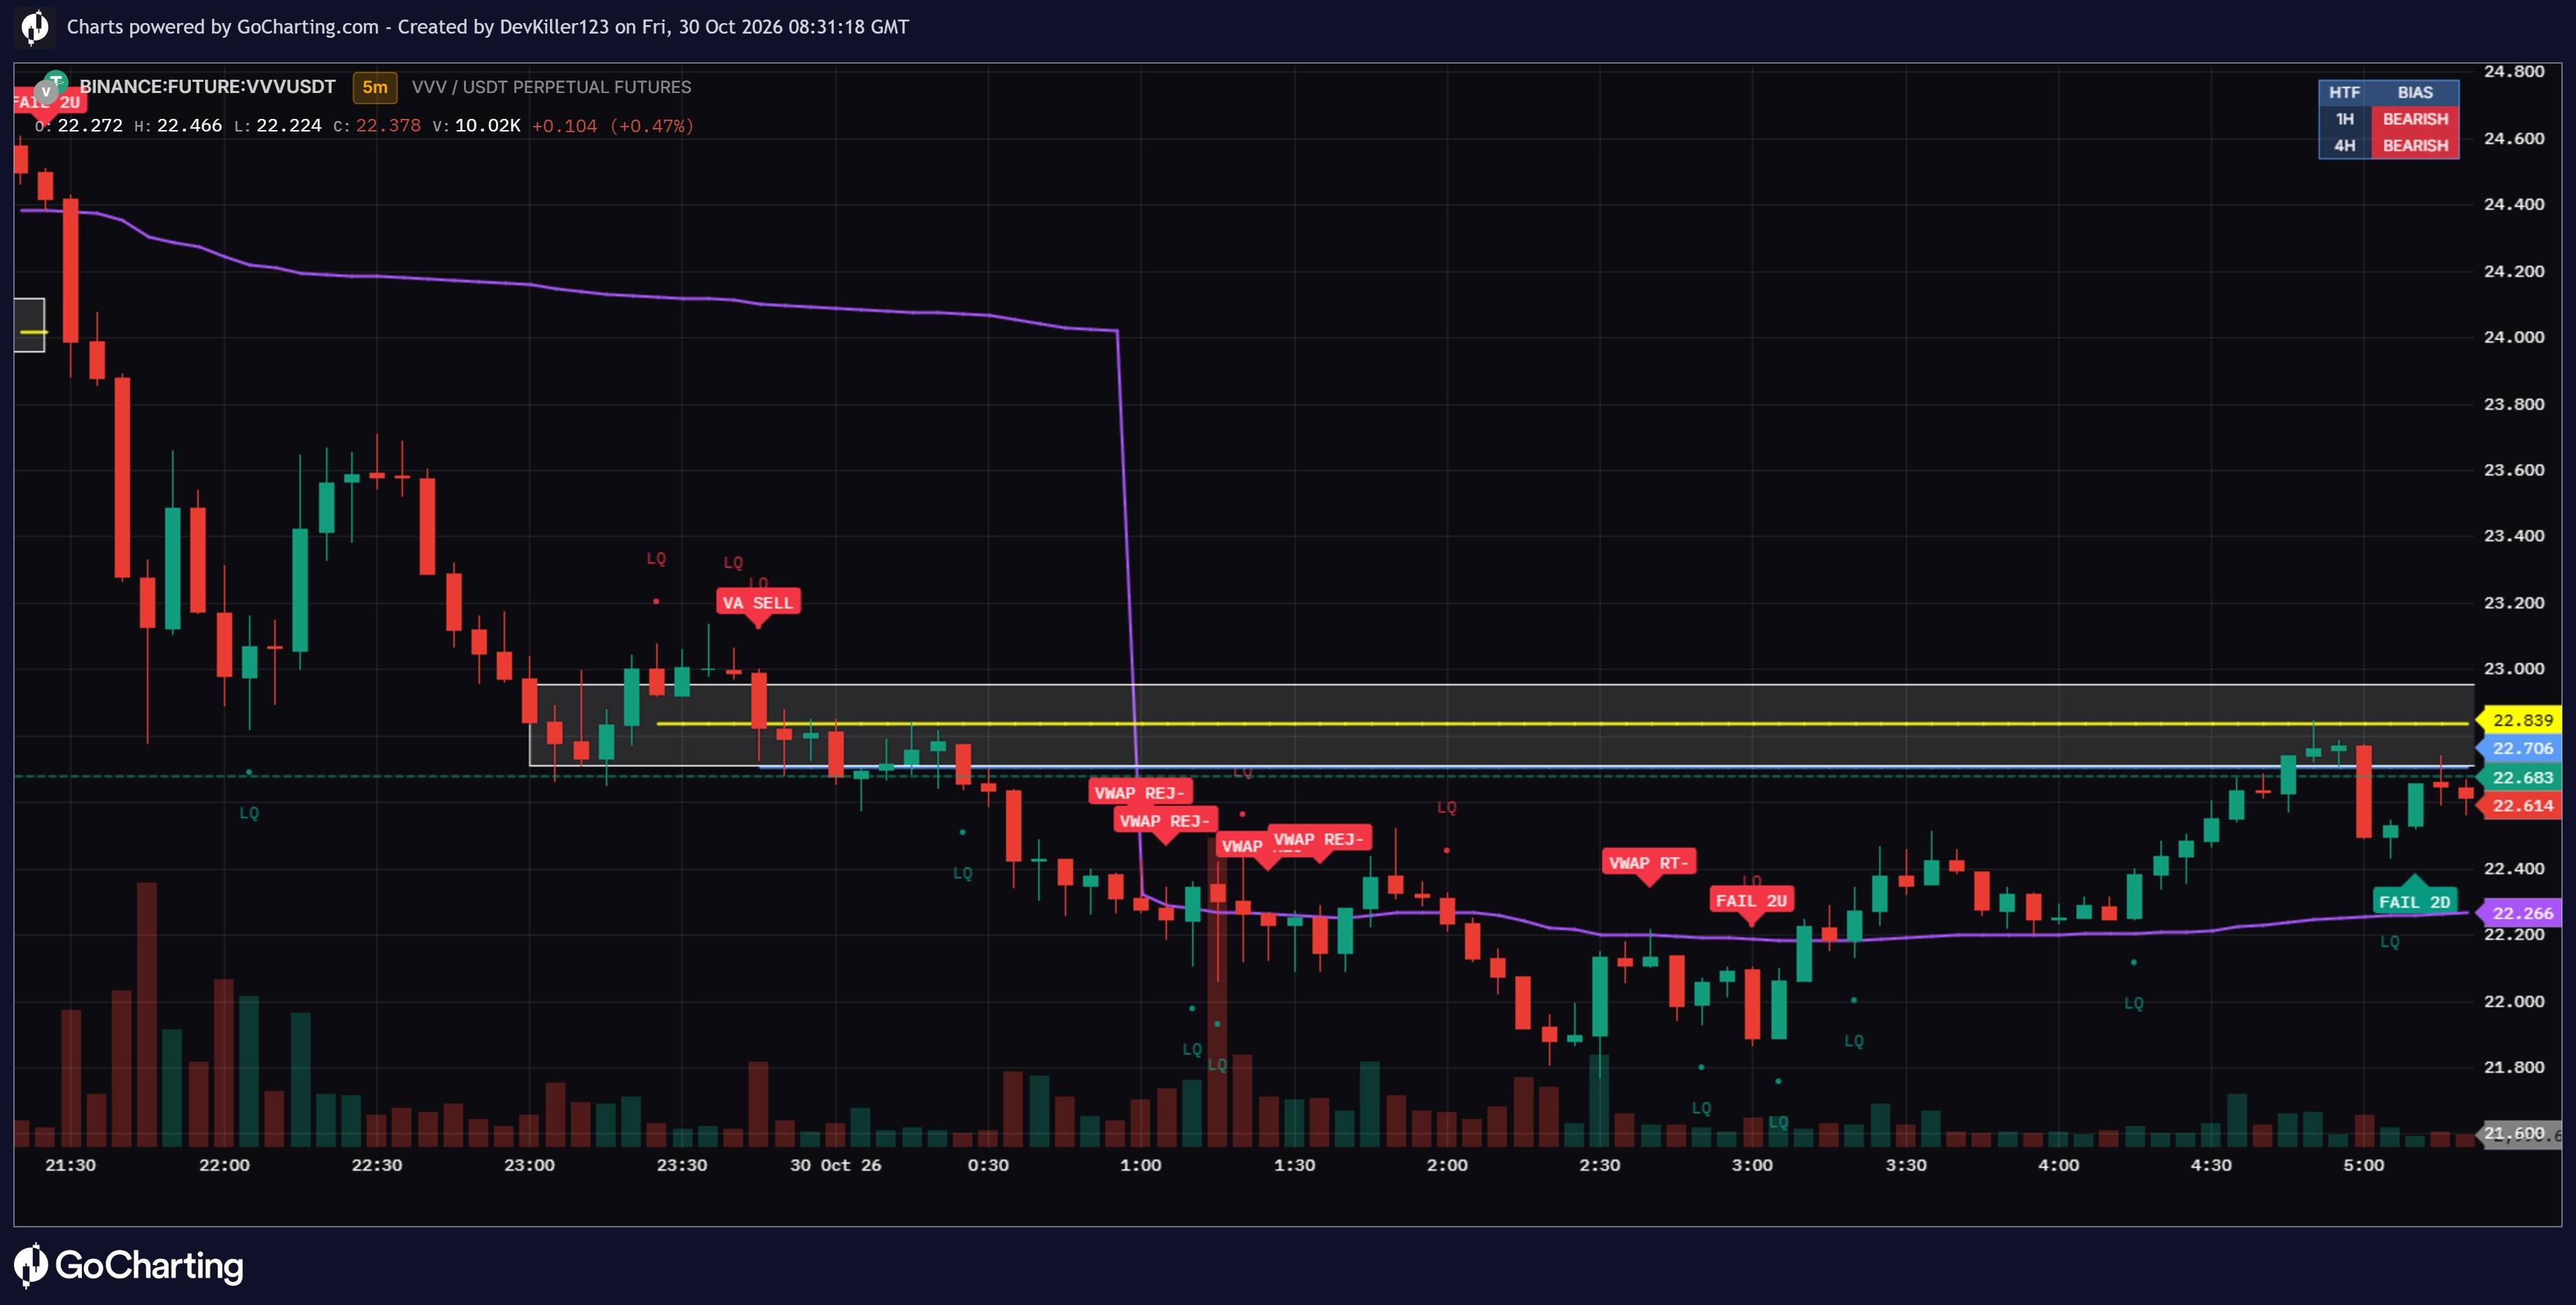
A separate Range-Anchored VWAP continuously tracks the developing volume-weighted price within each range. Its line can be colored using Trend, Slope, Price, or the experimental Value Transfer model.
This provides an additional perspective on whether price movement is supported by changes in the underlying volume-weighted equilibrium.
The information and publications are not meant to be, and do not constitute, financial, investment, trading, or other types of advice or recommendations supplied or endorsed by GoCharting. Read more in the Terms of Use.
Related Scripts
Comments (0)
Loading comments…