Opening Range Breakout - ORB Statistics [Dots3Red]
⏱️ OPENING RANGE BREAKOUT - ORB STATISTICS [Dots3Red]
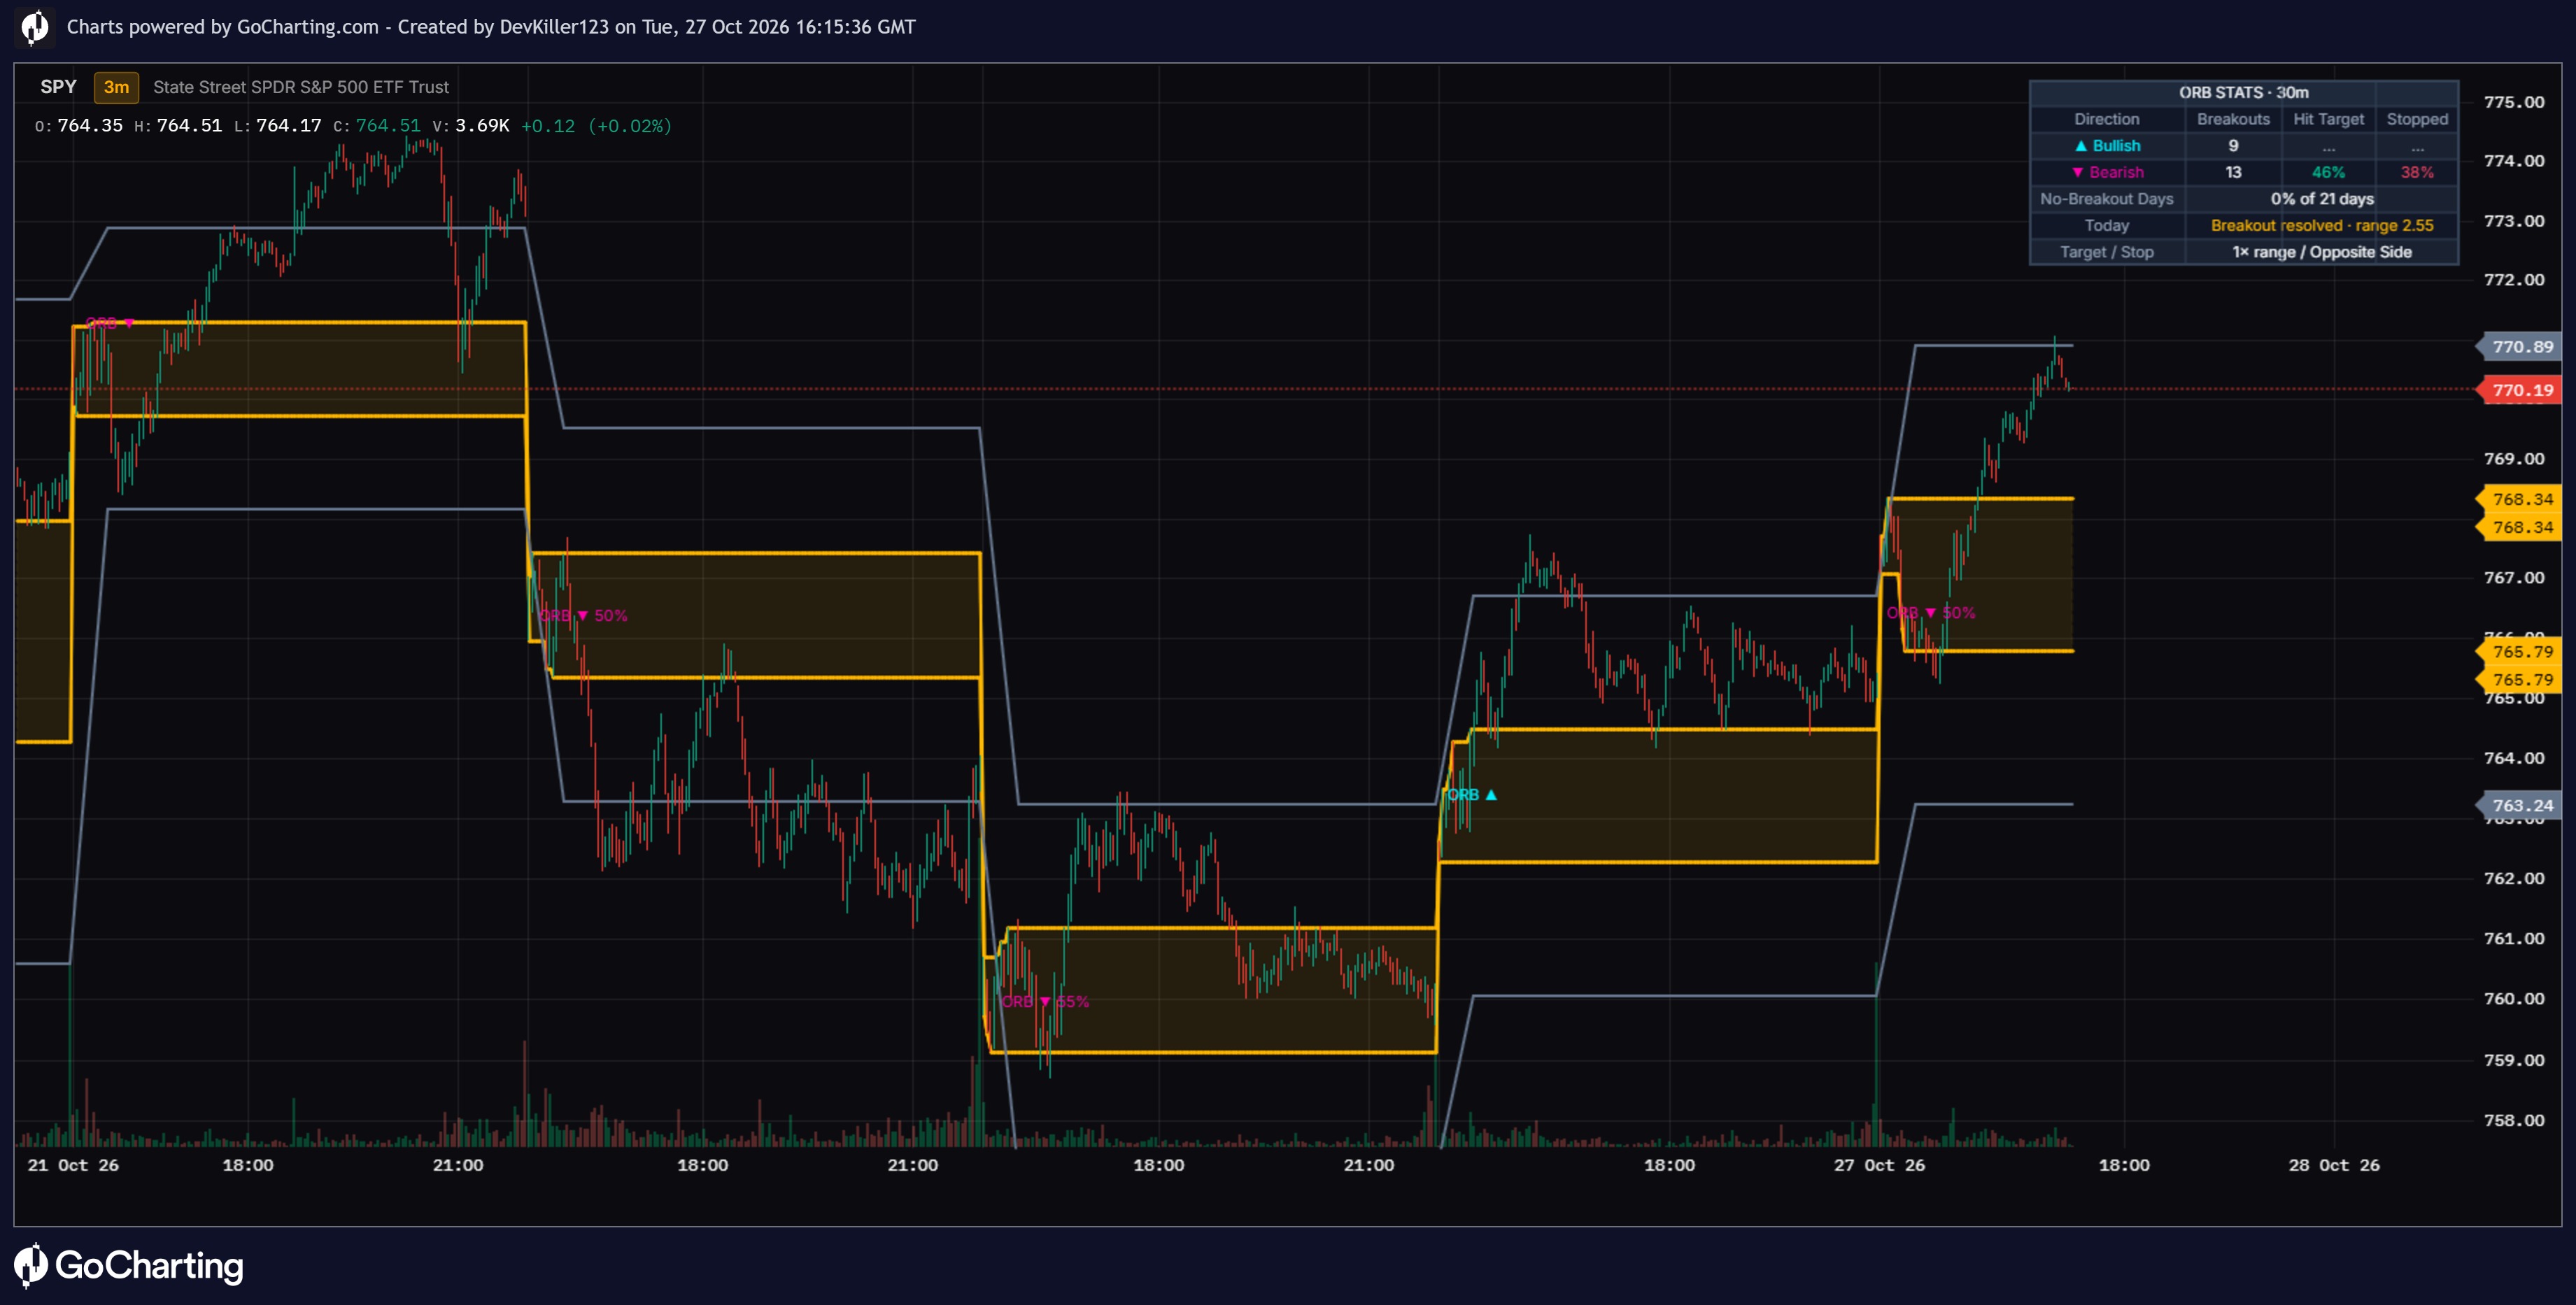
This indicator marks the opening range (the high and low of the first N minutes of each session), flags the first breakout of that range each day, and measures how often those breakouts reached their target versus hit their stop on the current chart.
✨ WHY THIS MATTERS
The opening range breakout is one of the oldest and most popular day-trading setups. The idea is simple: the first minutes of a session set the battle lines, and a decisive break of them often starts the day's main move. In practice, many breakouts reverse straight back into the range. How often the setup works varies a lot from instrument to instrument and with the length of the range. This script keeps score of the first breakout of every session, so you can see how the setup has actually behaved on your chart.
⚙️ HOW IT WORKS
⏱️ The opening range — the high and low of the first N minutes after each new session begins (30 minutes by default). The range is drawn as two lines with an optional fill, and it builds live while the window is still open.
🚀 First breakout only — the first candle that closes above the range high (bullish) or below the range low (bearish) after the window ends is the day's breakout. Later breaks the same day are ignored, which keeps every day as one clean sample.
🎯 Grading — each breakout is graded against two levels fixed at the moment of the break:
• Hit target — price travels a set multiple of the range size beyond the broken side
• Stopped — price returns to the other side of the range (or its midpoint, if you choose)
If both happen on the same bar, it counts as stopped. A breakout still open when the session ends counts in neither column.
📊 No-breakout days — the share of sessions where price never closed outside the range at all, which is useful context for range-bound instruments.
🔒 Non-repainting — breakouts are detected on closed candles and graded on confirmed bars only.
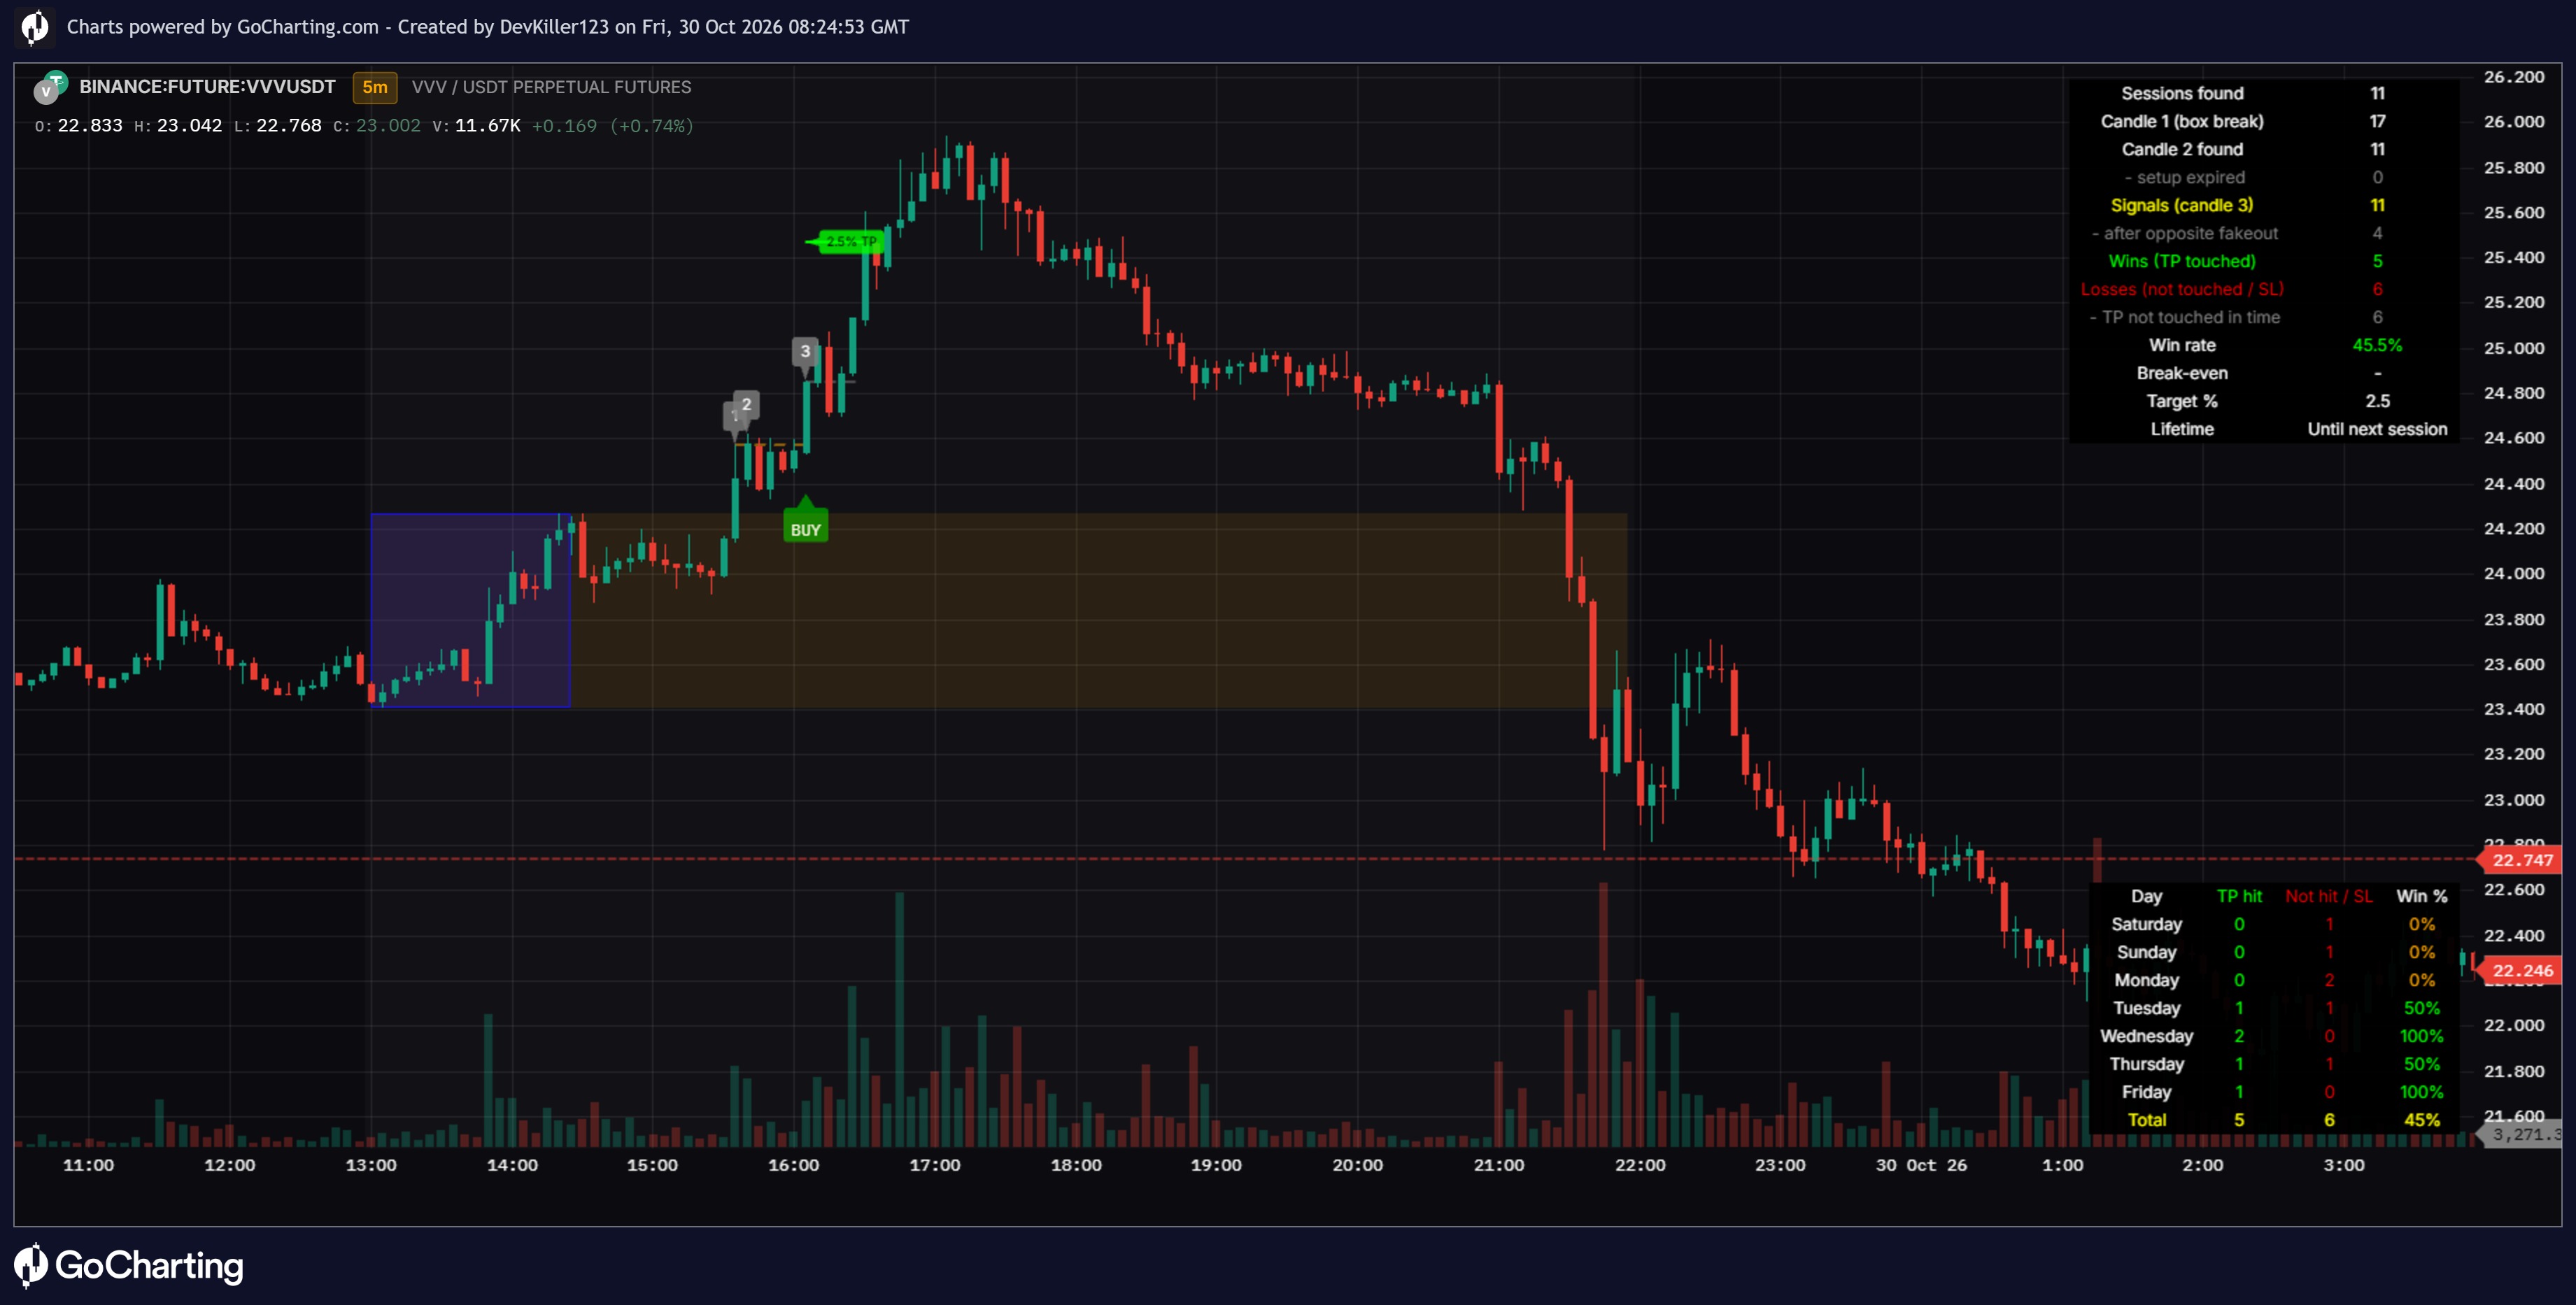
🖥️ Dashboard — breakouts, hit-target rate and stopped rate for each direction, no-breakout days, today's status and range size, and the target/stop settings.
🧭 HOW TO USE
1️⃣ Compare hit target vs stopped. A setup where bullish breakouts hit target 55% of the time and get stopped 30% of the time behaves very differently from one at 35% / 55%.
2️⃣ Compare directions. On trending instruments one side often works far better than the other.
3️⃣ Try different range lengths. 15, 30 and 60 minutes can give very different results on the same instrument. The dashboard updates instantly.
4️⃣ Tune target and stop to your plan. A midpoint stop is tighter and gets hit more often; a larger target is reached less often but pays more.
5️⃣ Use it as context, not a trigger. The rates describe how opening-range breakouts have behaved on this chart. They do not predict today's session.
⏱️ WHICH TIMEFRAMES WORK BEST
1-minute to 15-minute charts, with a chart timeframe no larger than the range length. The dashboard warns you if the chart timeframe is too high. The setup is designed for instruments with a clear session open, such as stocks, index futures and forex sessions; on 24-hour markets the session starts at the exchange's daily boundary.
🛠️ SETTINGS
⏱️ Opening Range — range length in minutes, optional custom session start (for example 0930-1600 for the US cash open on futures or extended-hours charts)
🎯 Breakout Grading — target (× range size), stop (opposite side or midpoint), minimum breakouts to show rates
🎨 Visuals — range line color and thickness, range fill and transparency, target levels and their color, breakout labels and their colors
🖥️ Dashboard — show/hide, position
🔔 Alerts — bullish breakout, bearish breakout
📝 NOTES
By default the session start follows the chart's own trading day: with extended hours enabled on a stock chart that is the pre-market open, and on futures it is the overnight open. Turn on the custom session start to anchor the range to a specific open instead. All rates are specific to this chart, timeframe and settings, and do not transfer to other instruments or configurations.
⚠️ DISCLAIMER
This is an analytical and visualization tool. It does not generate trade signals and does not constitute financial advice. Historical statistics do not guarantee future performance.
The information and publications are not meant to be, and do not constitute, financial, investment, trading, or other types of advice or recommendations supplied or endorsed by GoCharting. Read more in the Terms of Use.
Related Scripts
Comments (0)
Loading comments…