Institutional Absorption & Delta Divergence

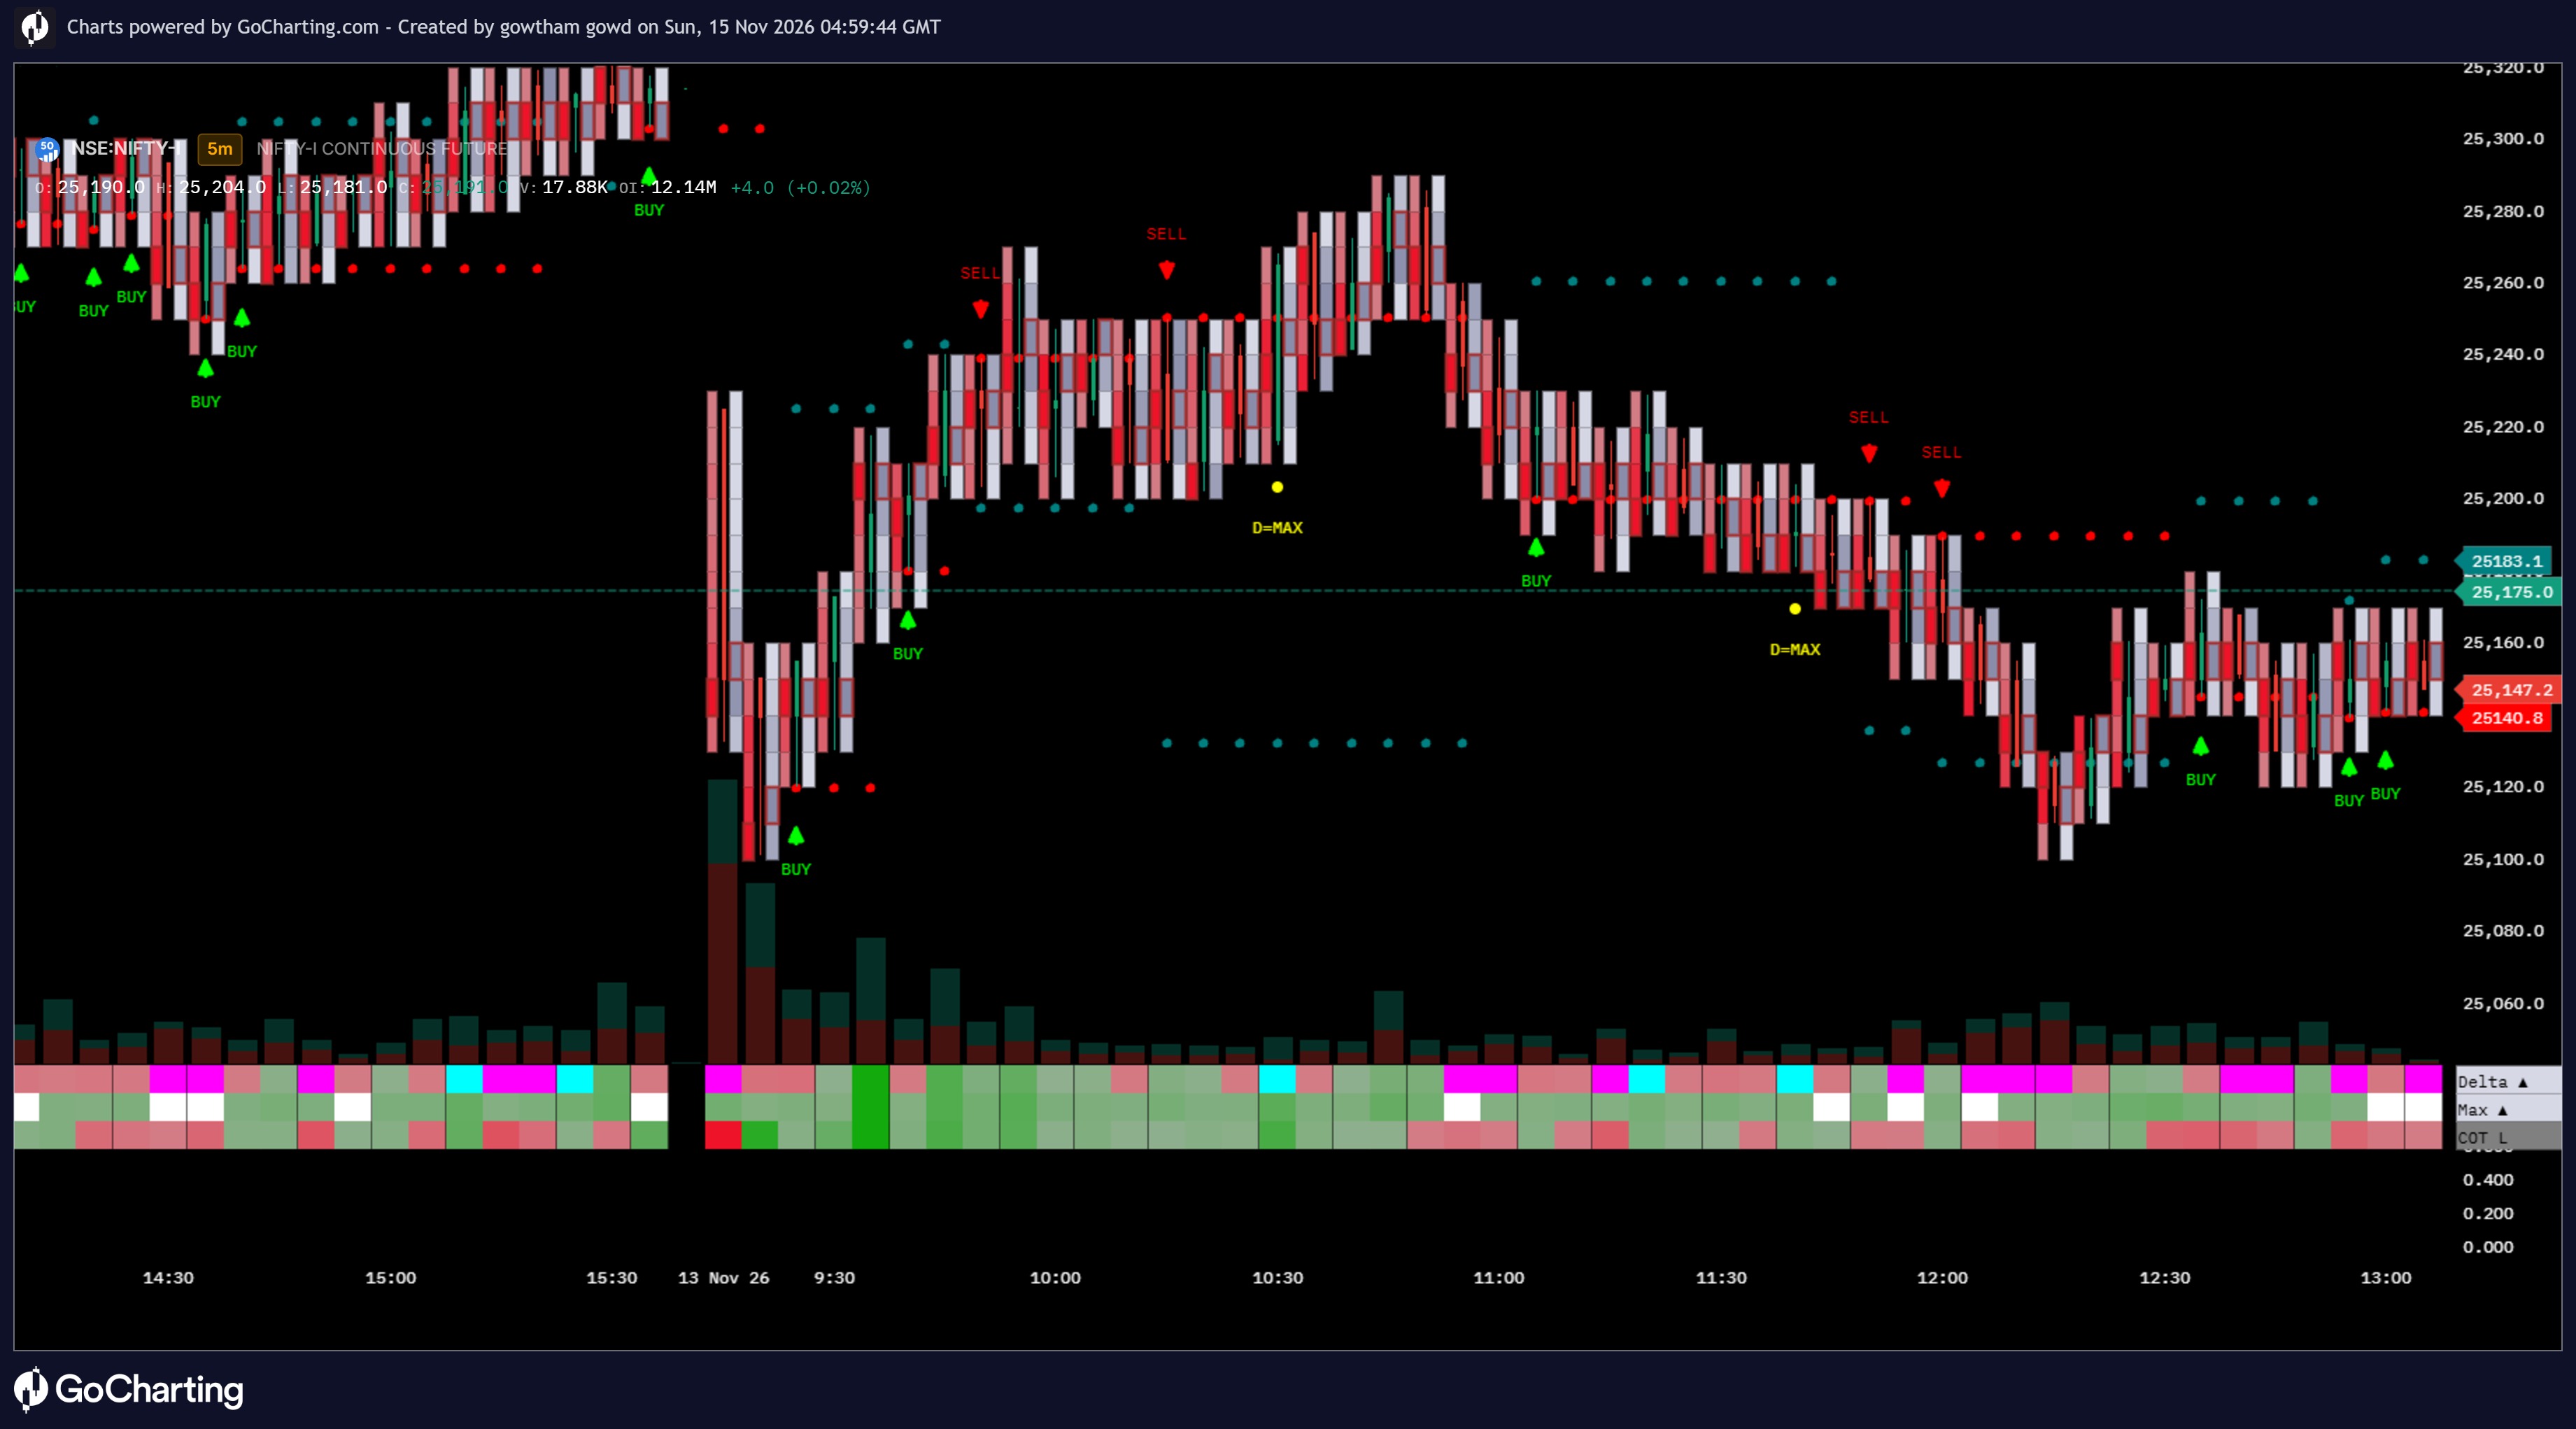
This indicator looks for bullish or bearish absorption using footprint order-flow delta, candle direction and rejection wick size. It can also check volume against its 20-bar average, delta strength against a rolling mean and standard deviation, and trapped volume at the candle’s wick. Signals are marked with BUY or SELL triangles and have separate alert conditions. For each signal, it plots stop-loss and take-profit levels for up to eight bars, using the signal candle’s wick, an optional tick buffer, and a risk-to-reward multiplier. Settings control the optional filters and their thresholds, delta lookback and minimum, wick ratio, candle-close or next-bar-breakout confirmation, stop buffer, and reward-to-risk ratio.
The information and publications are not meant to be, and do not constitute, financial, investment, trading, or other types of advice or recommendations supplied or endorsed by GoCharting. Read more in the Terms of Use.
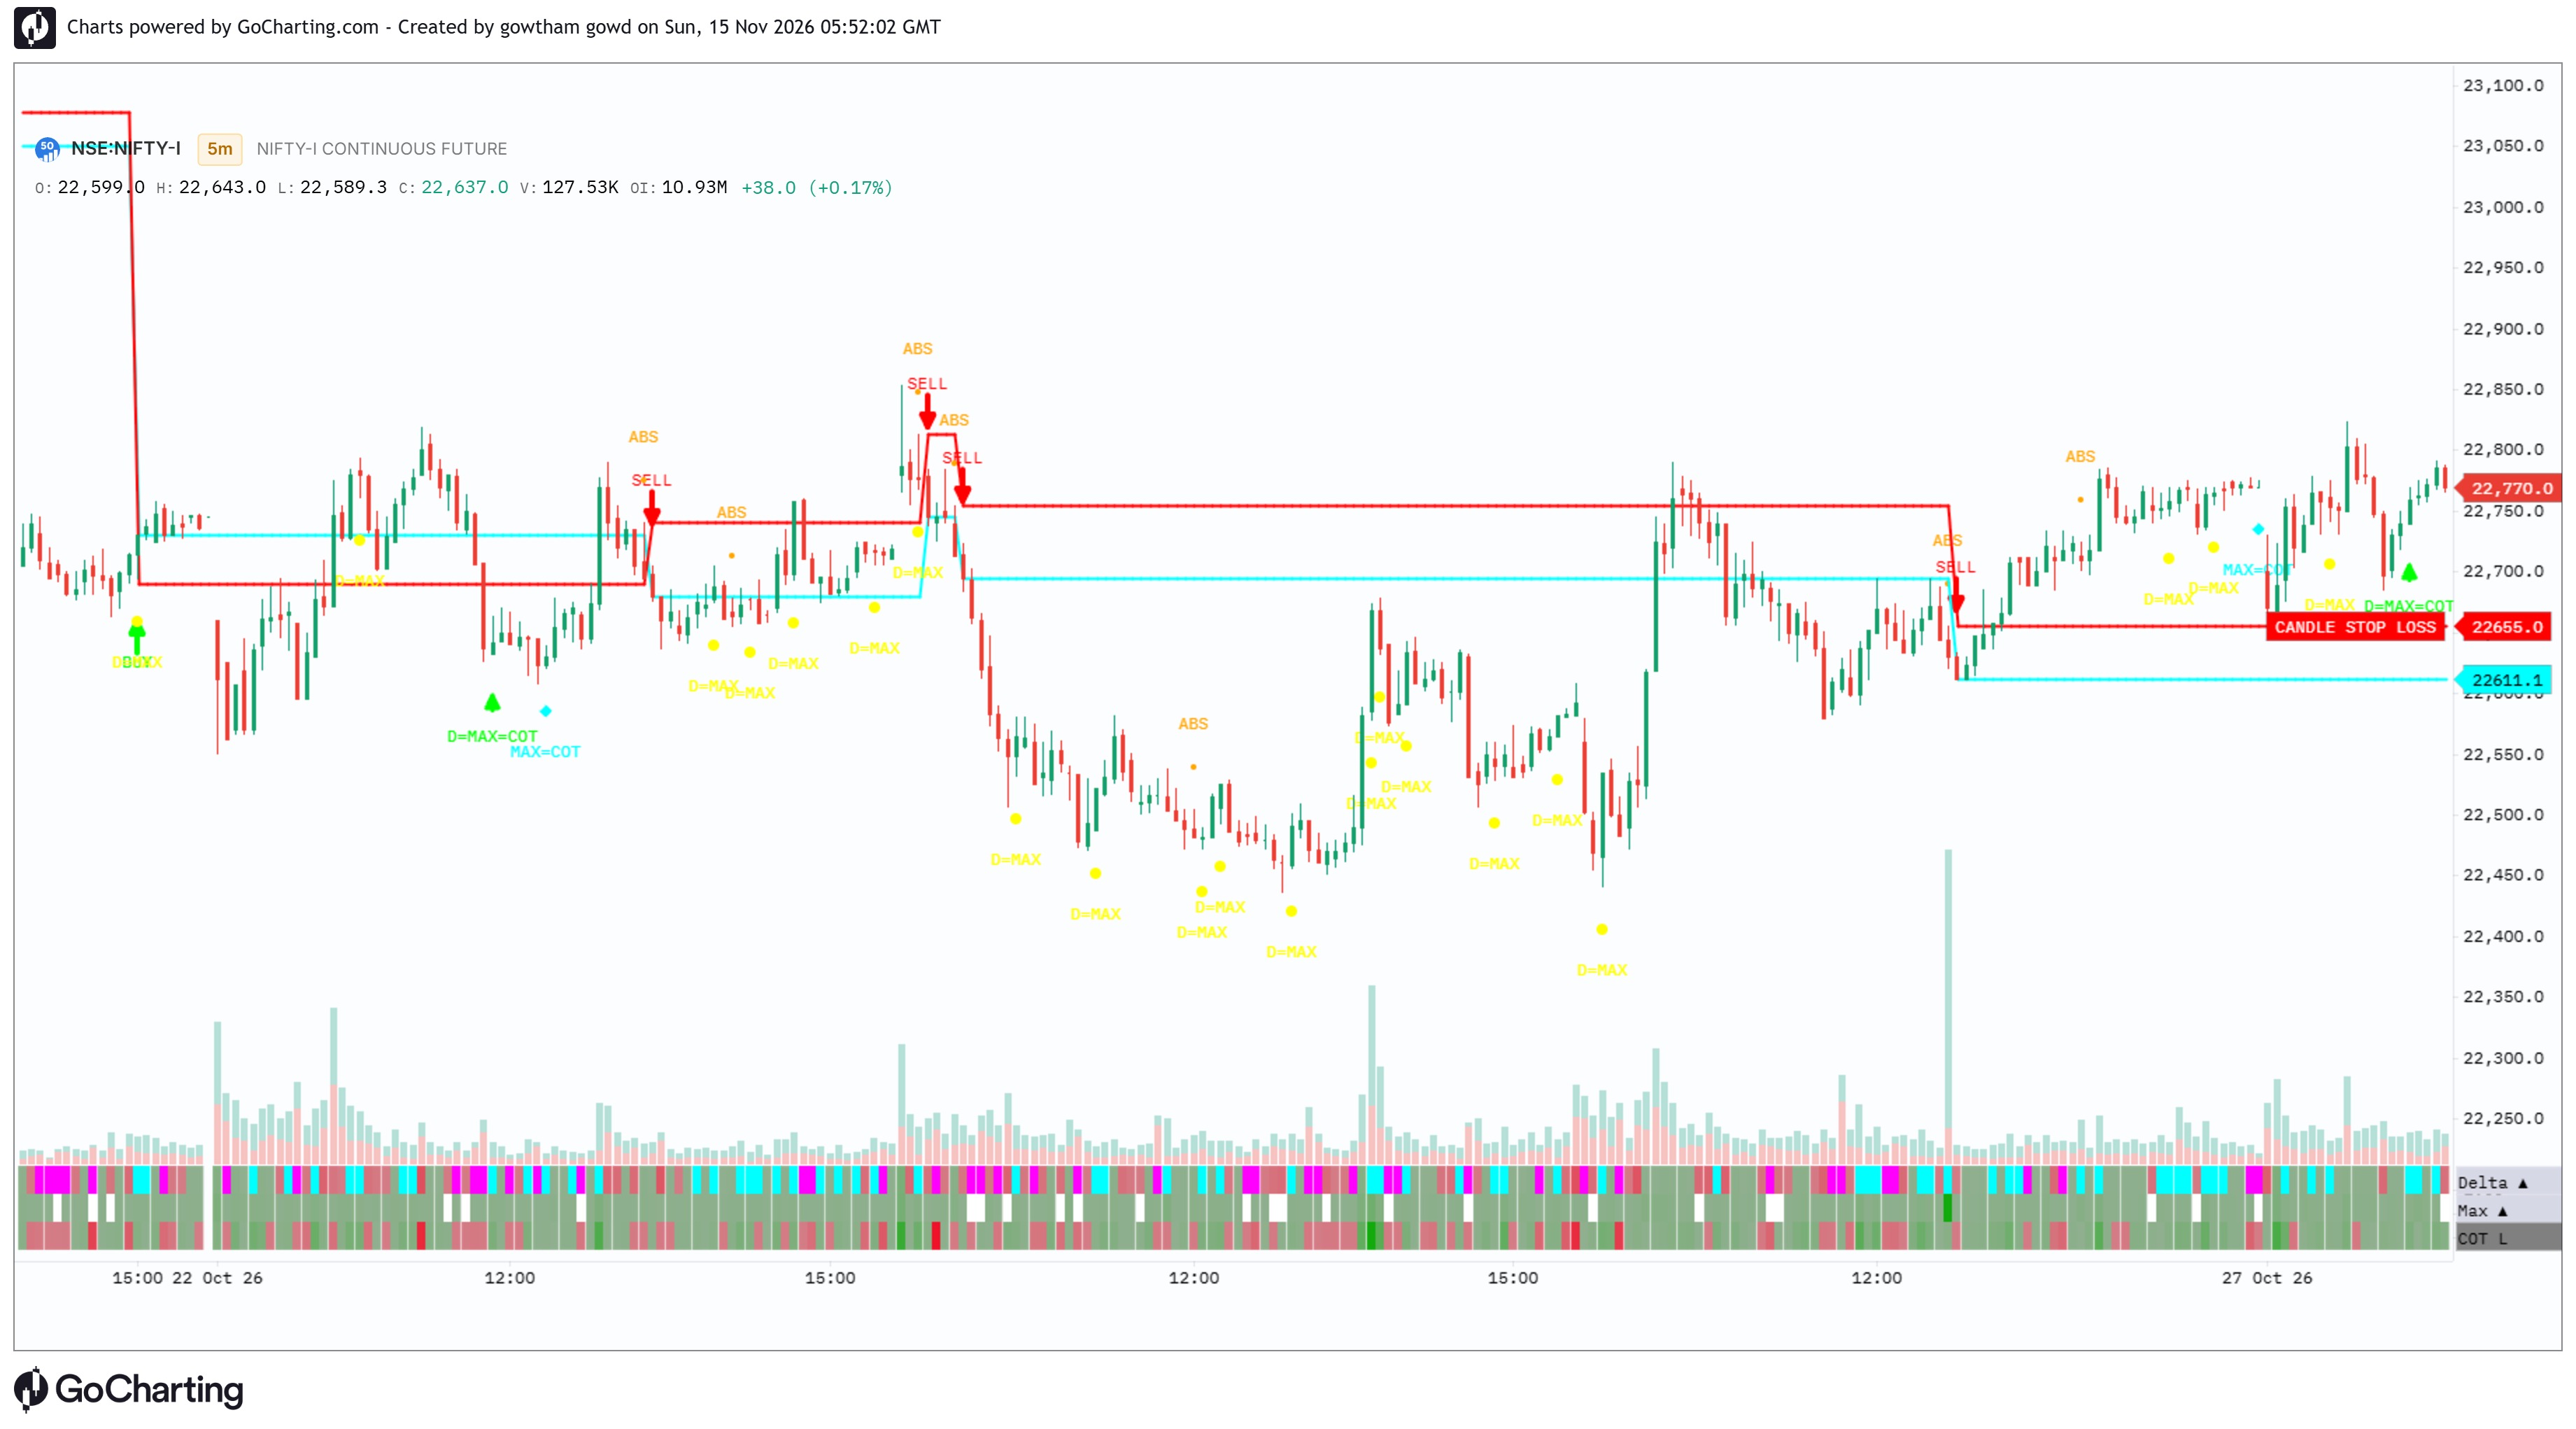
Related Scripts
Comments (0)
Loading comments…