Institutional Absorption Reversal PRO

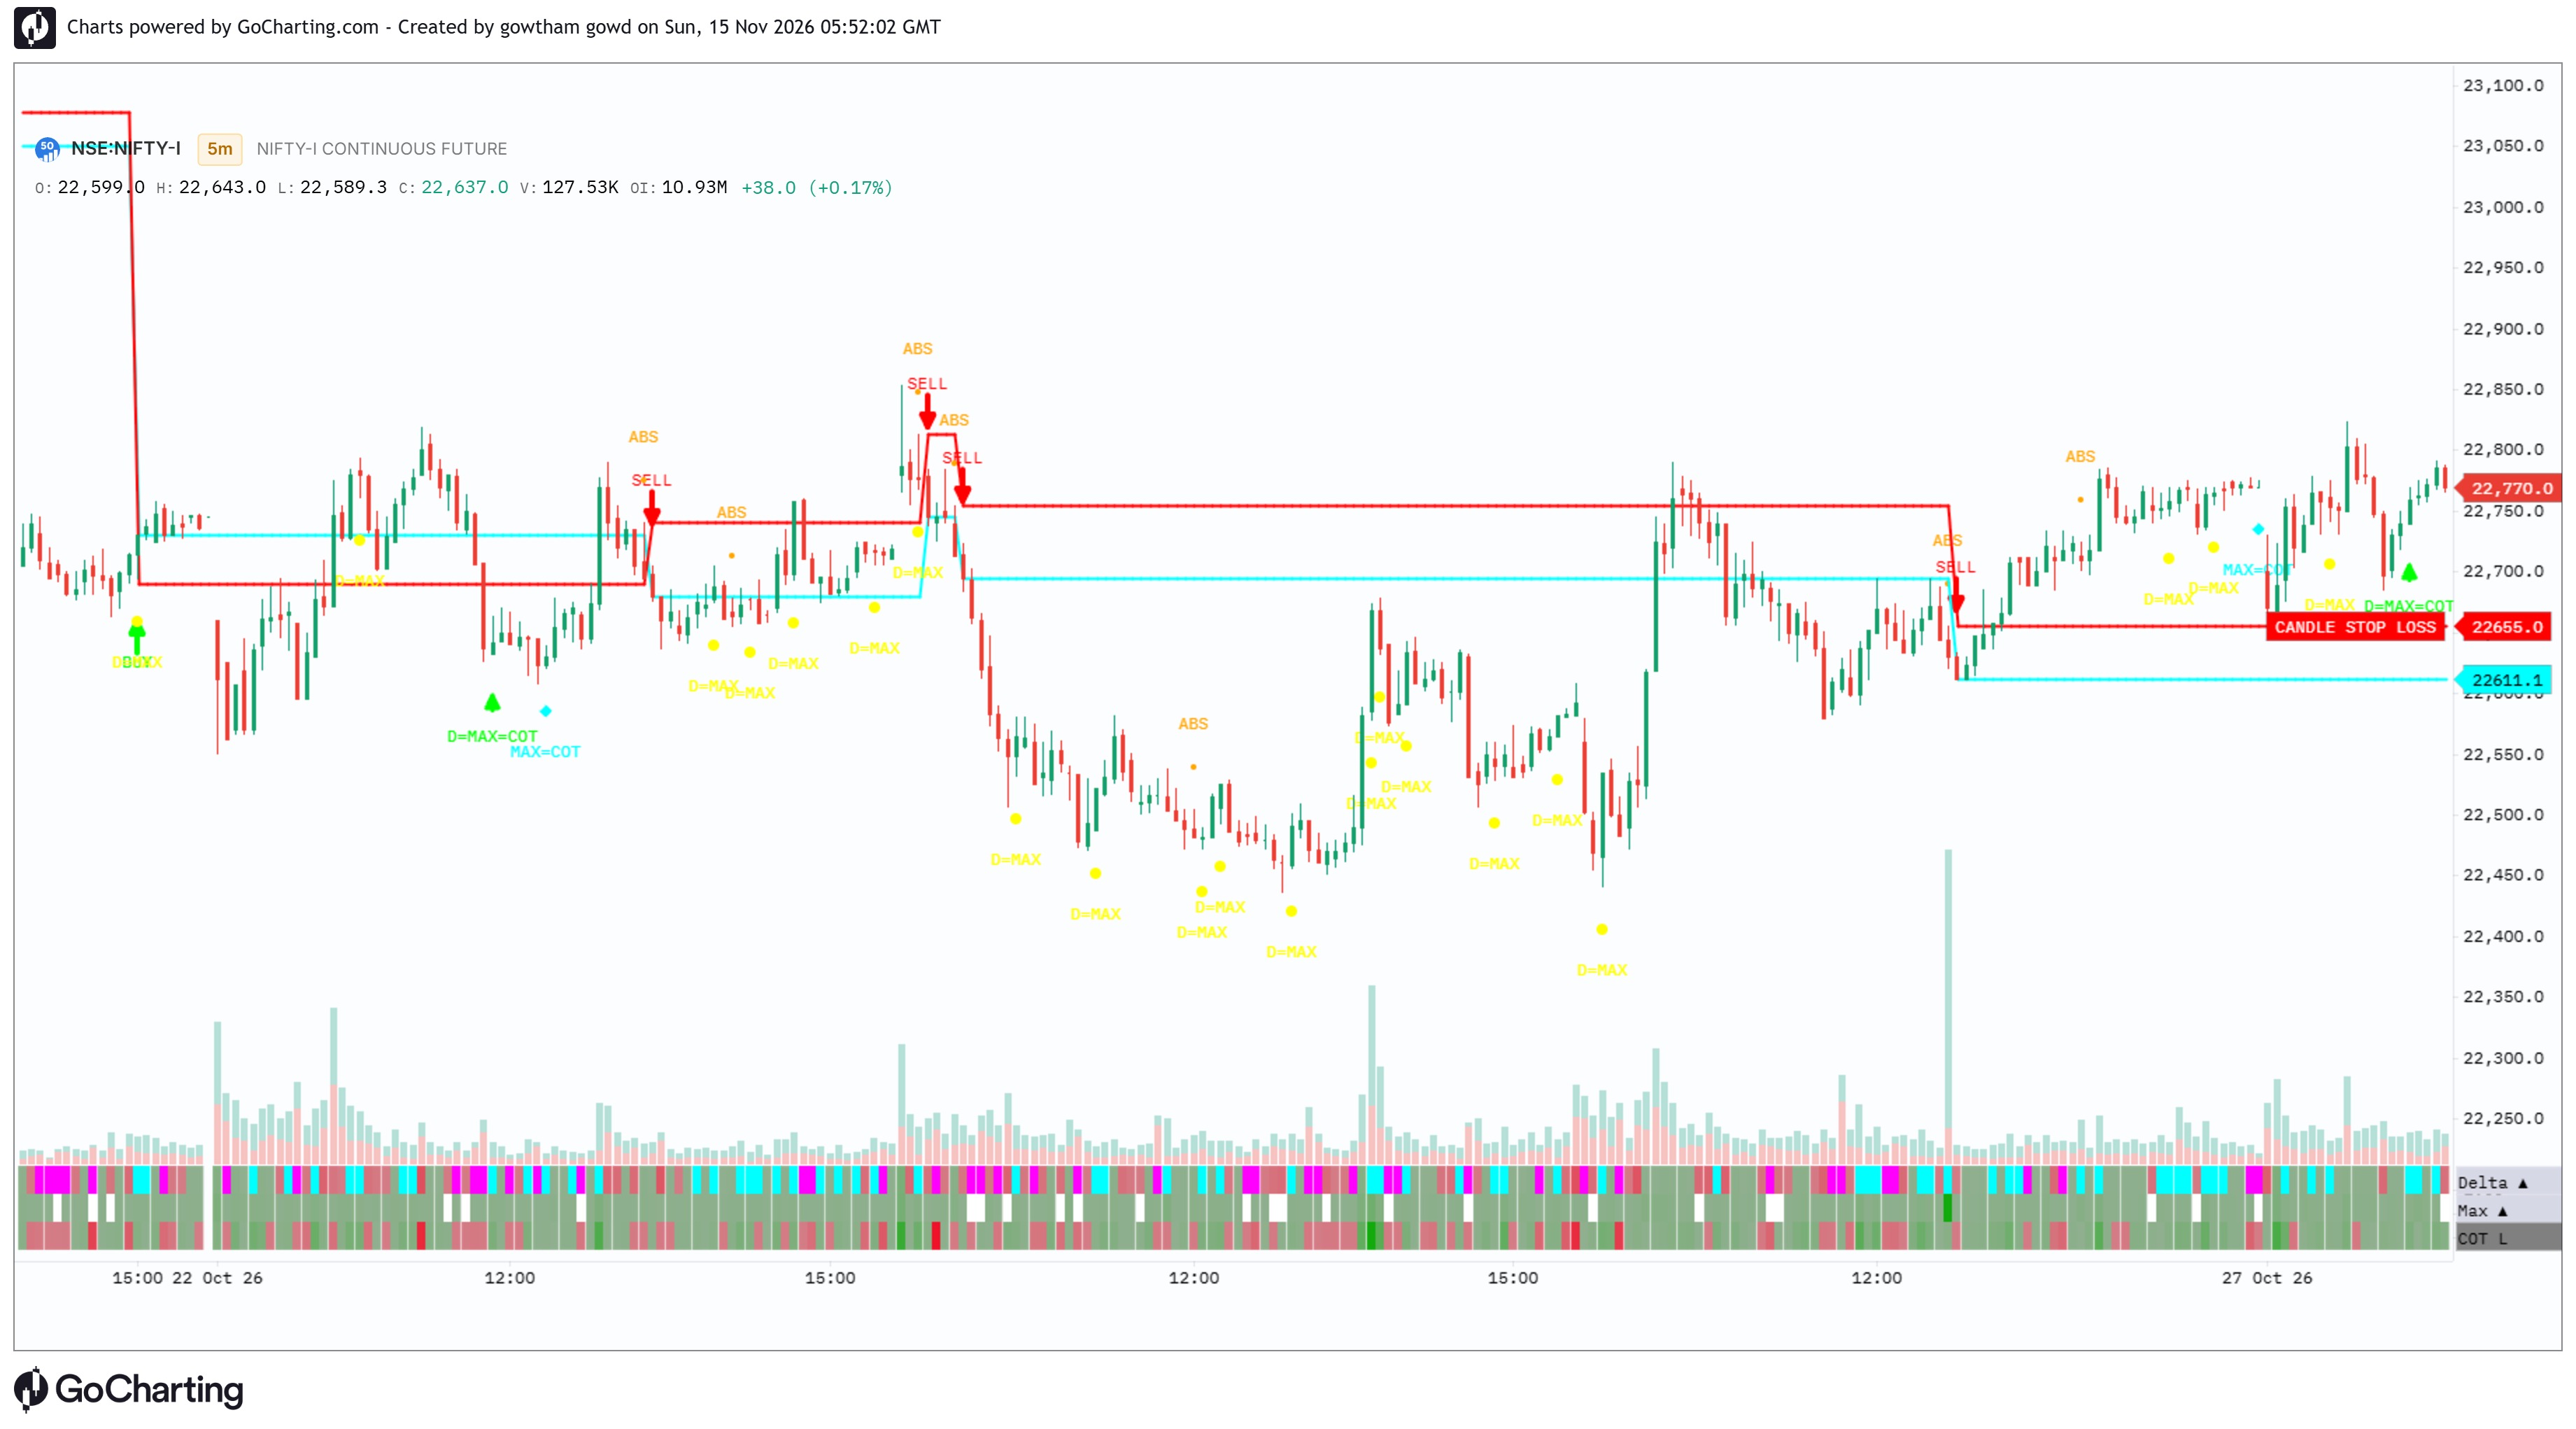
This indicator compares bar delta and intrabar maximum or minimum delta with volume to identify strong buying or selling pressure. It marks possible absorption when the candle’s wick and direction meet its conditions and the high or low stays within the prior two-bar range. On the following bar, a close beyond the absorption candle can trigger a BUY or SELL arrow. Small ABS markers identify absorption bars. It also plots the signal close as an entry-price line, the saved absorption-candle low or high as a stop reference, and delta as a separate plot. The script has no user-adjustable settings.
The information and publications are not meant to be, and do not constitute, financial, investment, trading, or other types of advice or recommendations supplied or endorsed by GoCharting. Read more in the Terms of Use.
Related Scripts
Comments (0)
Loading comments…