Fear and Greed Index

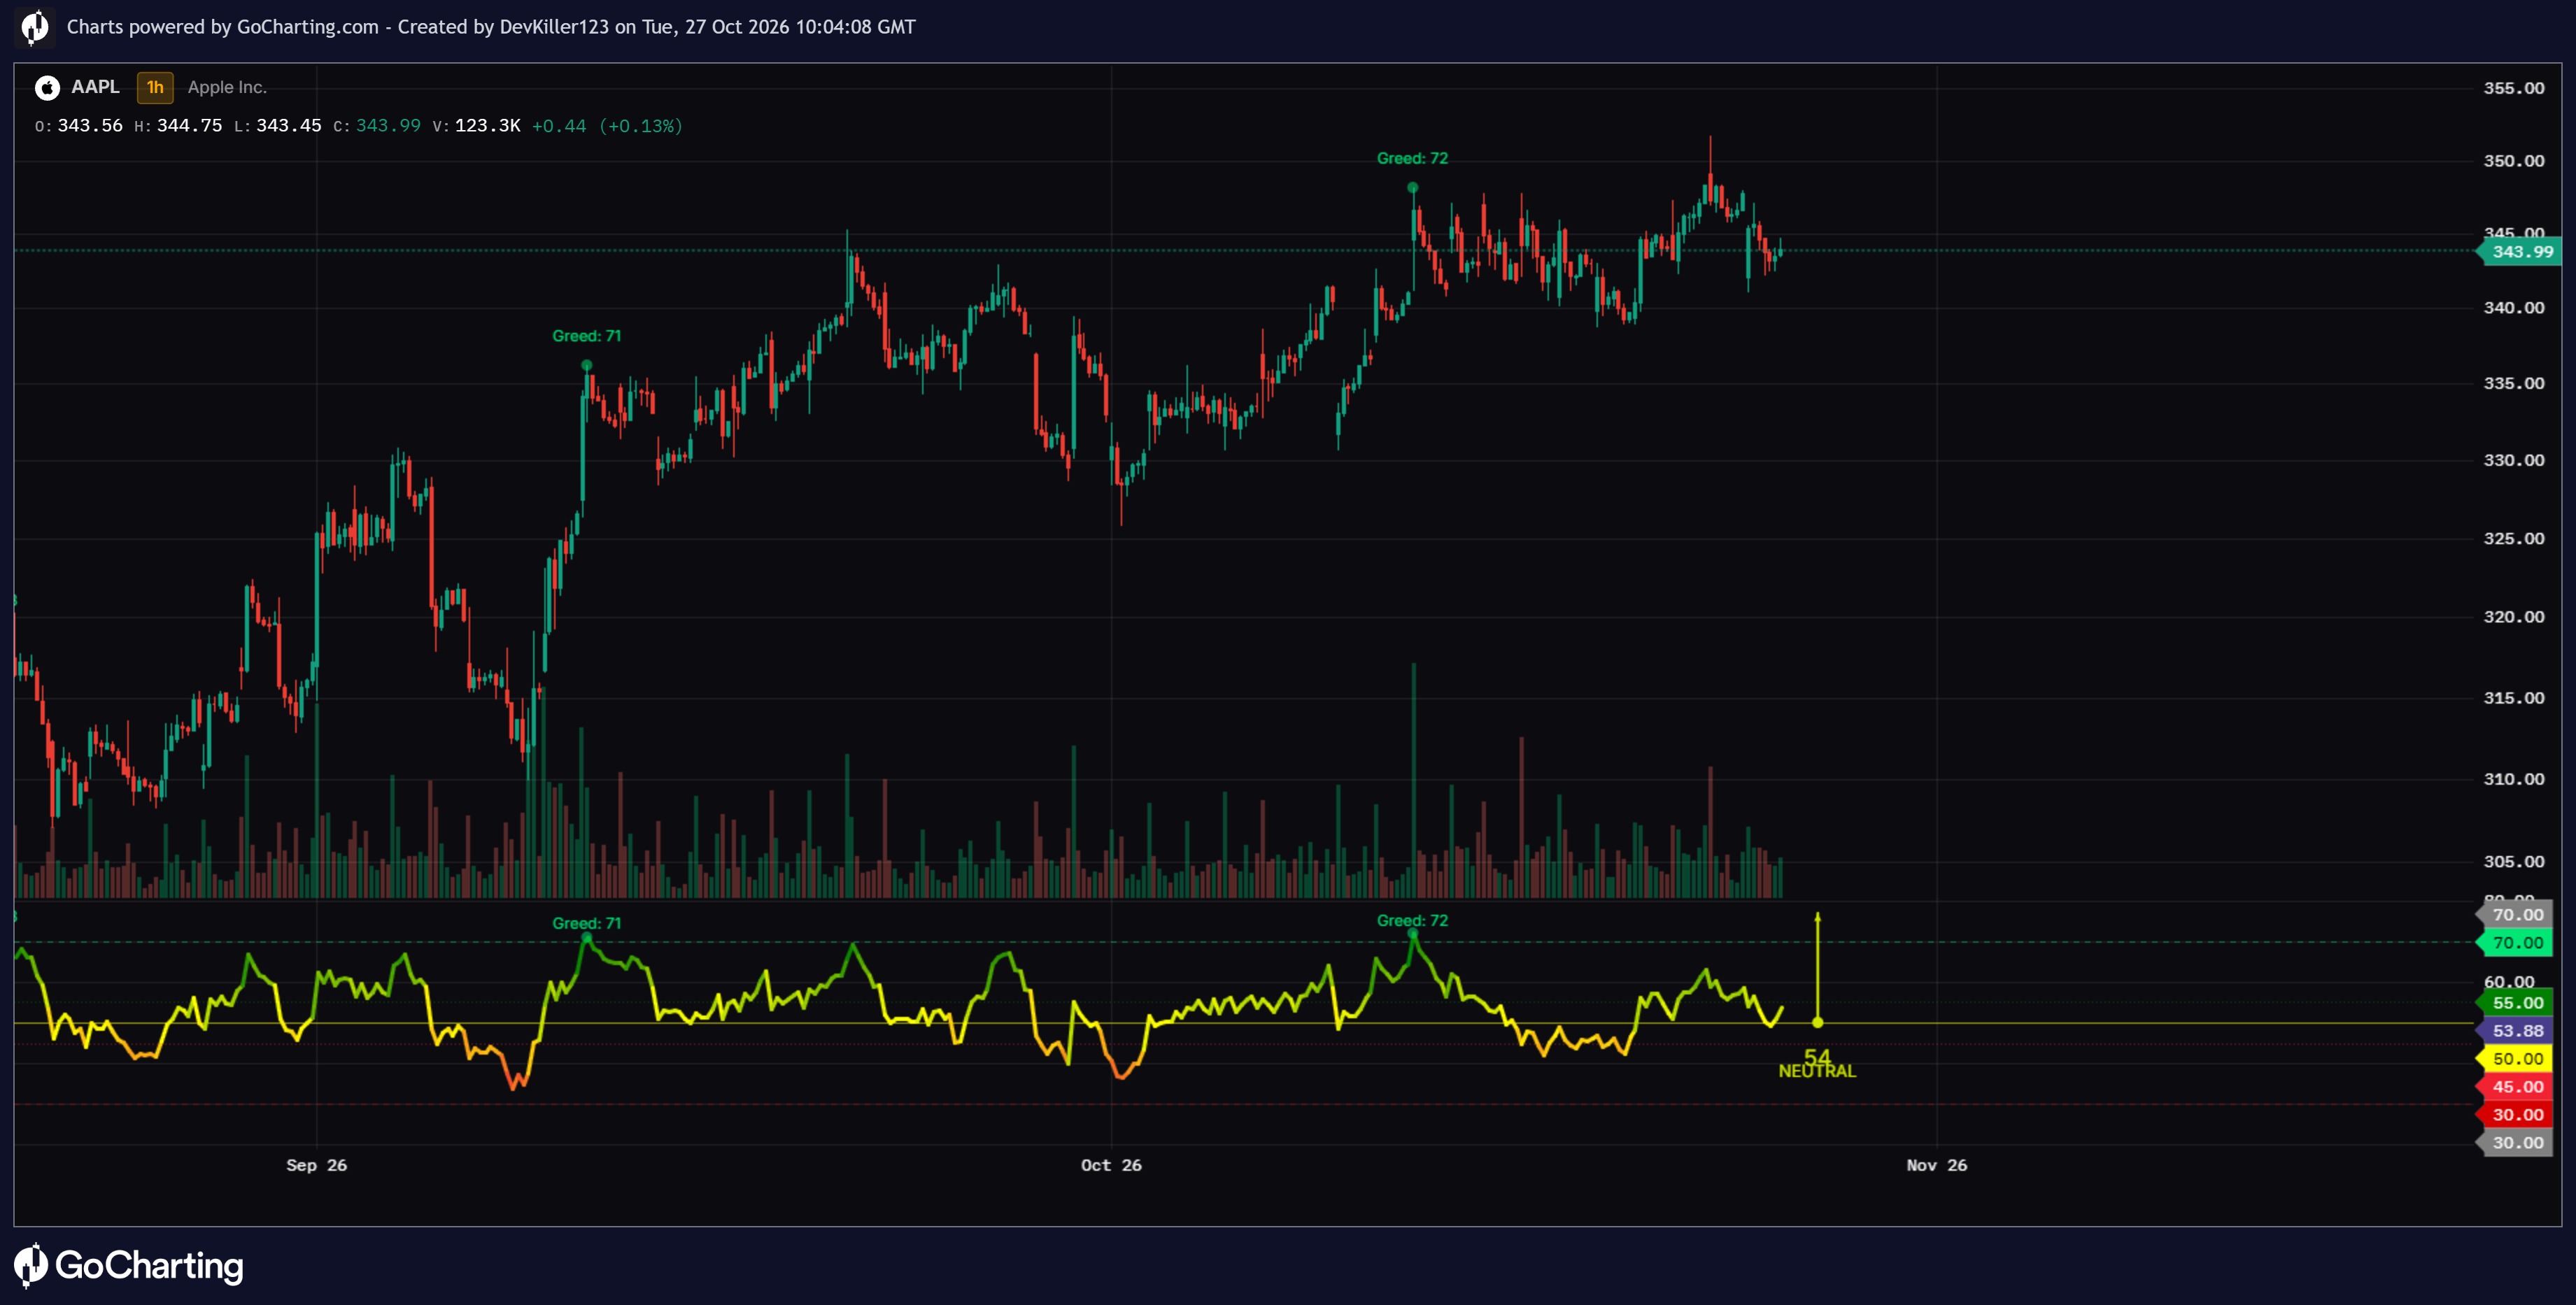
The Fear and Greed Index [BigBeluga] is an advanced technical analysis indicator designed by BigBeluga to measure market sentiment and momentum without incorporating traditional volatility metrics. Traditional sentiment tools often rely on complex external feeds or noisy indicators. To solve this limitation, this script computes a composite Fear & Greed index on a 0 to 100 scale using three core market factors: Momentum (Relative Strength Index), Trend (distance from Simple Moving Average), and Volume Flow (buying versus selling volume pressure).
The indicator features a selectable Gauge Type input, allowing traders to toggle between a classic dual-track polyline Arc gauge and a Vertical gradient box scale gauge rendered on the last bar of the chart.
HOW IT WORKS
The system operates through an integrated architecture where each component dynamically influences calculations and visuals:
1 — Multi-Factor Sentiment Engine
Momentum Factor: Evaluates price momentum using the Momentum (RSI) Length input (default 14), scaling values from 0 to 100. Adjust this parameter shorter (e.g., 7 to 10) for fast scalping on lower timeframes, or longer (e.g., 21 to 28) for macro sentiment analysis.
Trend Factor: Measures normalized distance from a baseline moving average governed by the Trend (SMA) Length input (default 50). Set this length shorter (e.g., 20) for responsive short-term trend tracking or longer (e.g., 100 to 200) for major market cycles.
Volume Flow Factor: Calculates buying versus selling volume pressure using the Volume Flow Length input (default 20).
2 — Composite Index & Threshold Logic
Composite Calculation: Averages the three normalized factors into a single Fear & Greed index value ranging from 0 to 100.
State Classification: Categorizes sentiment into five distinct states (Extreme Fear, Fear, Neutral, Greed, Extreme Greed) using configurable Overbought (Extreme Greed) Level (default 70) and Oversold (Extreme Fear) Level (default 30).
3 — Flexible Gauge Display & Visuals
Gauge Type Selection: Choose between Arc (polyline semidisk with directional needle) and Vertical (stacked gradient box scale with numeric ticks and pointer labels) via the Gauge Type input. Control vertical scale resolution using the Vertical Scale Box Count setting.
Gradient Oscillator & Signals: Plots the sentiment curve with a smooth 5-color gradient and fires confirmed breakout labels on the oscillator and main chart overlay when crossing extreme thresholds.
🔵 HOW TO USE
Apart from serving as a comprehensive market sentiment tracker, the indicator can be applied in several ways:
Identify Sentiment Extremes: Monitor when the composite index breaches the overbought or oversold threshold lines to spot potential market exhaustion zones.
Track Momentum Shifts: Follow the gradient-colored oscillator curve and shaded threshold fills in the separate pane to gauge ongoing buying or selling pressure.
Choose Your Preferred Visual Display: Switch between the arc gauge and the vertical bar scale on the right edge of the chart for an instant readout of current market fear or greed.
🔵 NOTES
Why this implementation is unique:
Combines momentum, trend deviation, and volume flow into a unified, volatility-free sentiment index.
Features dual selectable gauge styles (Arc vs. Vertical gradient boxes) rendered dynamically on the final chart bar.
Fully optimized for Pine Script version 6 with robust signal gap filtering and custom 5-color gradient mapping.
The information and publications are not meant to be, and do not constitute, financial, investment, trading, or other types of advice or recommendations supplied or endorsed by GoCharting. Read more in the Terms of Use.
Related Scripts
Comments (0)
Loading comments…