Vwap with Vwap Deviation

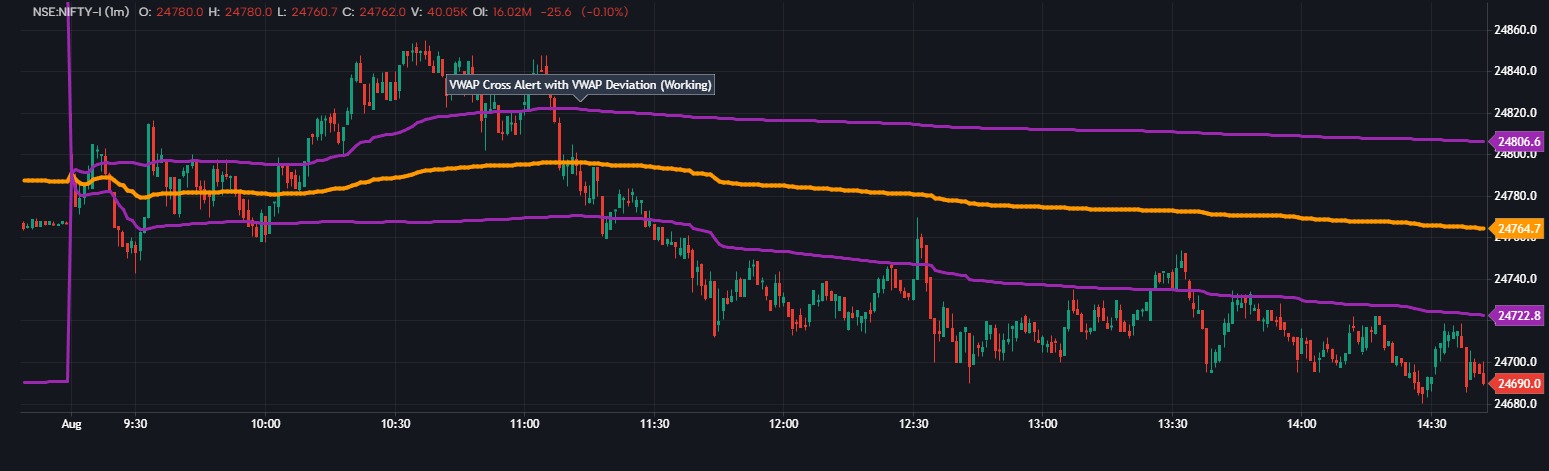
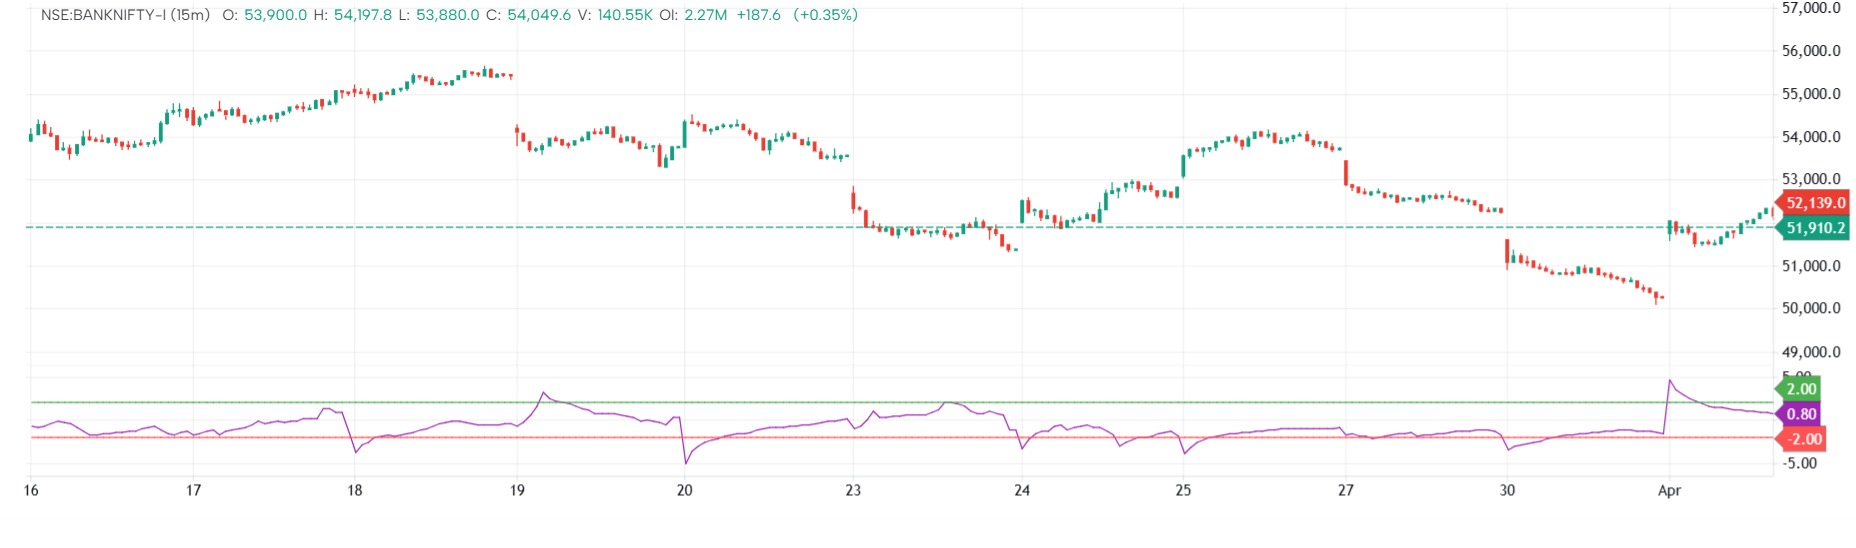
This indicator tracks the Volume Weighted Average Price (VWAP) throughout each trading session and plots upper and lower deviation bands to visualize volatility. The deviation bands help traders identify when price moves significantly away from the VWAP, which can signal overbought or oversold conditions.
Bullish and bearish cross signals are generated when the price crosses above or below the VWAP, highlighting potential trend shifts or entry opportunities. The deviation multiplier is adjustable, allowing traders to control the sensitivity of the bands to better fit their strategy and the asset’s volatility.
Overall, this tool combines VWAP anchoring with dynamic volatility bands and clear visual alerts to support intraday trend following and mean reversion trading.
The information and publications are not meant to be, and do not constitute, financial, investment, trading, or other types of advice or recommendations supplied or endorsed by GoCharting. Read more in the Terms of Use.
Related Scripts
Comments (2)
Loading comments…