 NIFTY
NIFTYNIFTY 50 INTRADAY TRADING PLAN – 28 SEP 2026

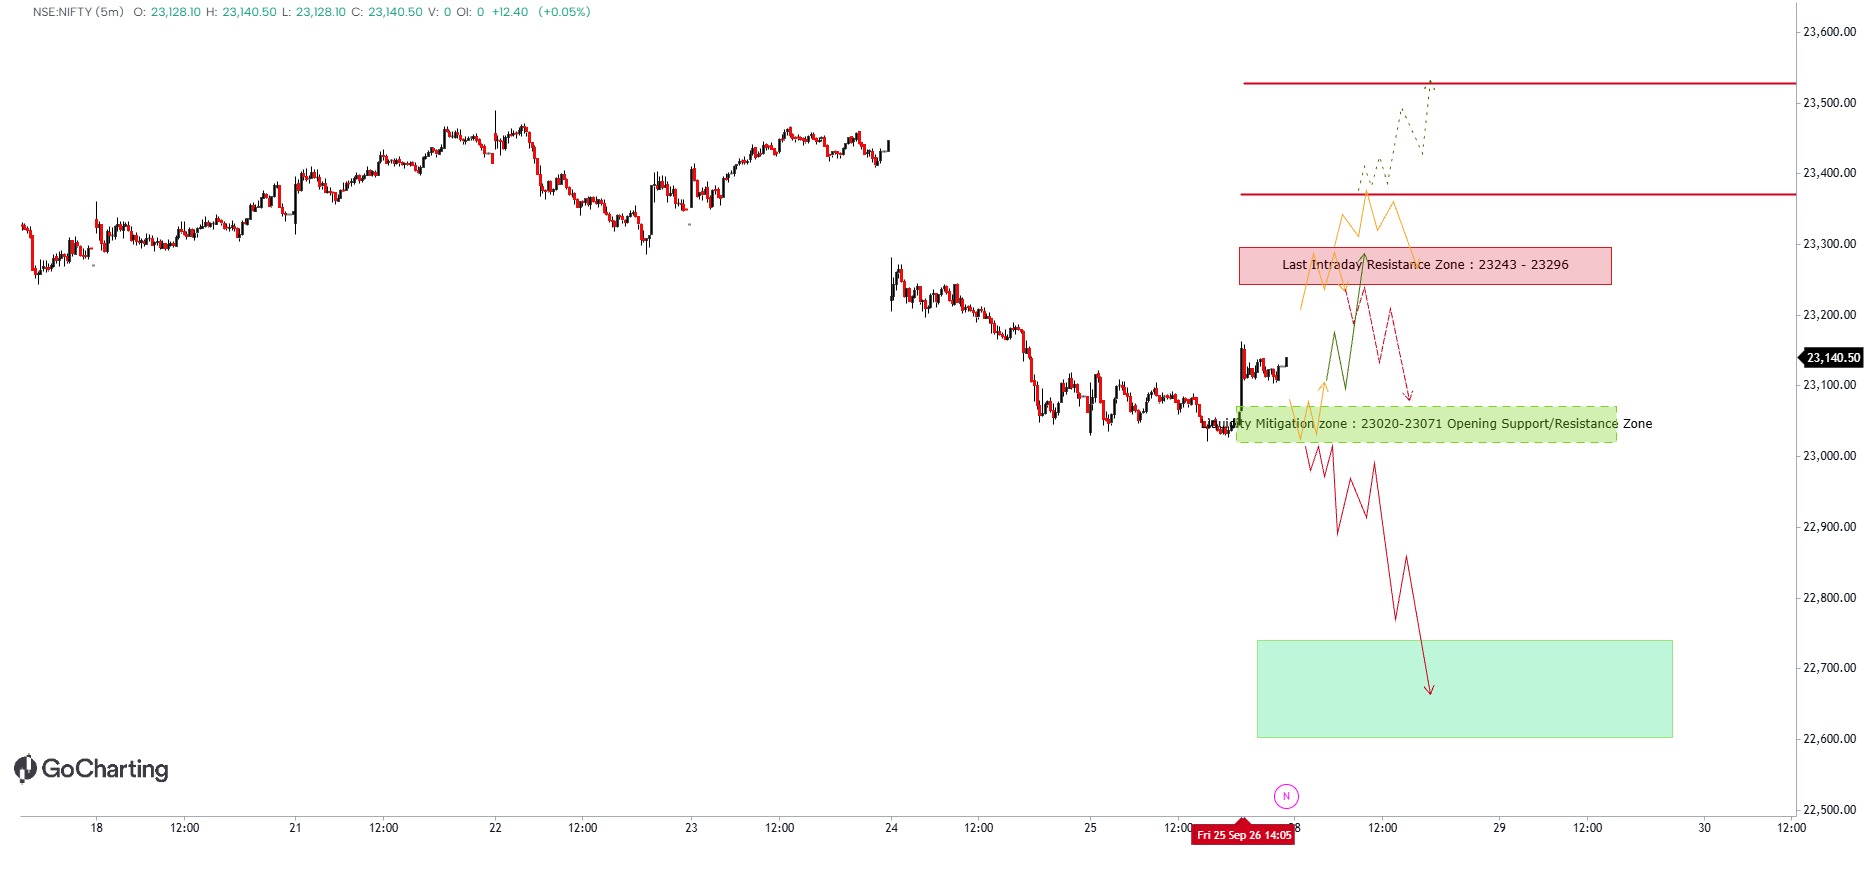
Previous Close: 23,127.60
Timeframe: 15-Minute
Market Structure: Bearish / Corrective
Intraday Bias: Neutral to Bearish below 23,243
━━━━━━━━━━━━━━━━━━━━
KEY LEVELS
🔴 Major Resistance: 23,527
🔴 Intermediate Resistance: 23,371
🔴 Last Intraday Resistance: 23,296
🟠 Opening Resistance Zone: 23,243–23,296
⚫ Previous Close: 23,127.60
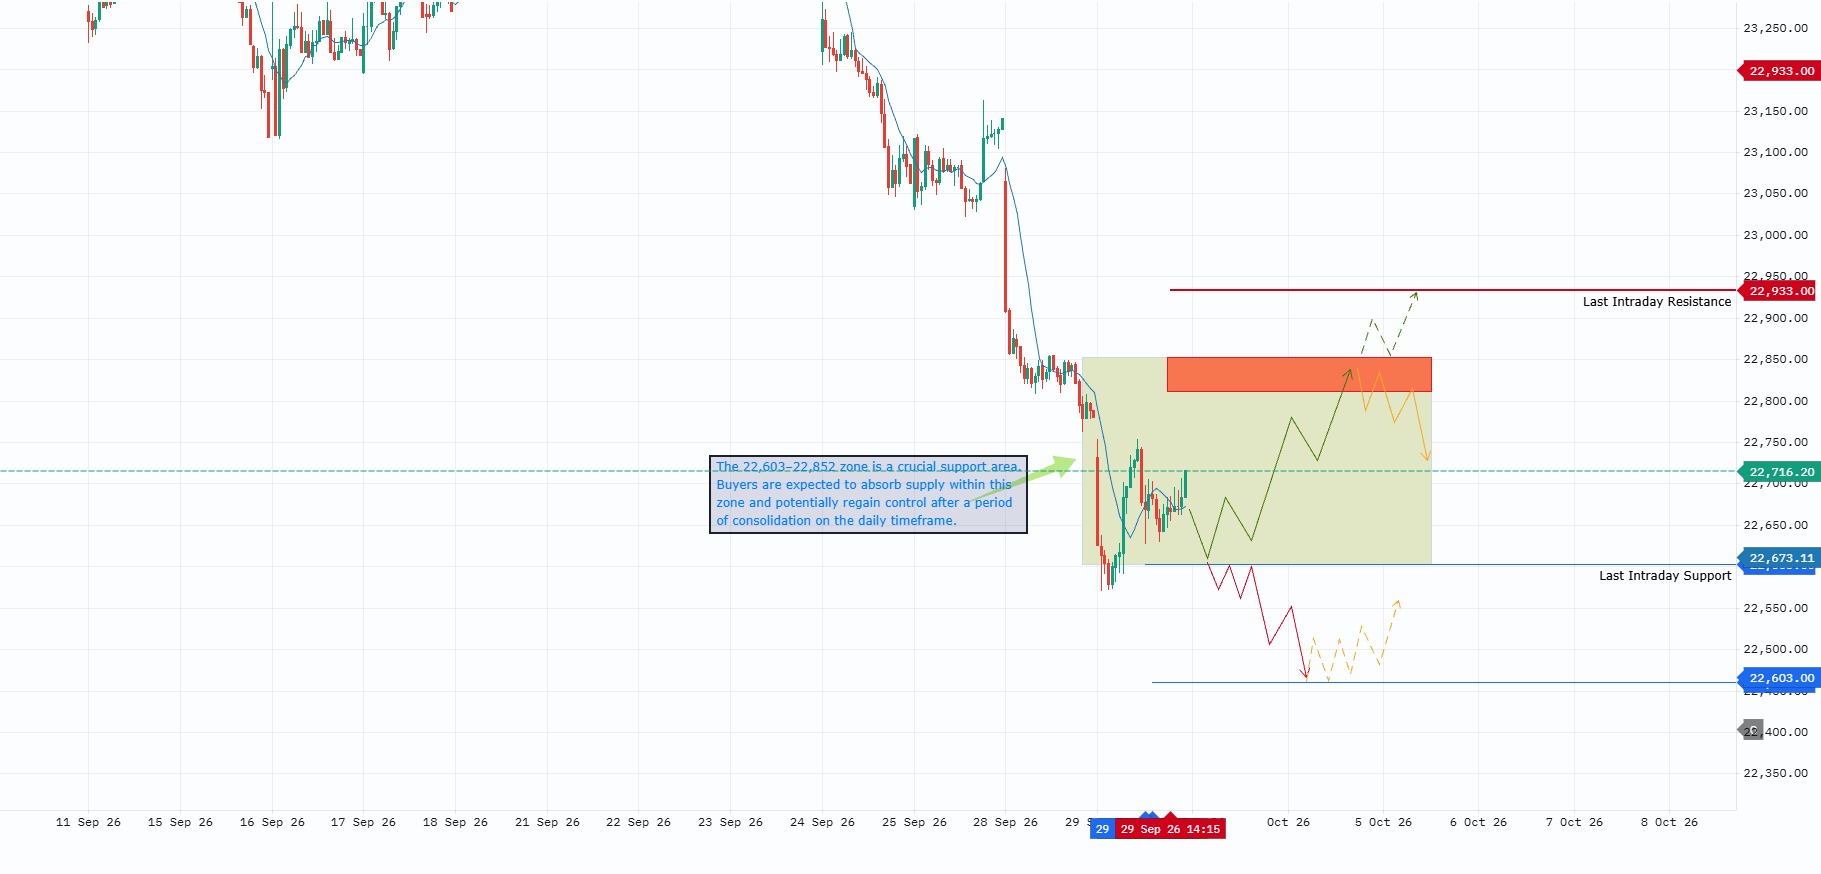
🟢 Opening Support / Liquidity Zone: 23,020–23,071
🔻 Major Lower Liquidity Zone: 22,602–22,739
━━━━━━━━━━━━━━━━━━━━
WHY THESE LEVELS MATTER
23,243–23,296
This is the immediate supply/resistance area visible on the 15-minute structure. Sustained acceptance above 23,296 can indicate that the immediate bearish pressure is weakening.
23,020–23,071
This is the key liquidity-mitigation and support area formed around recent price activity. It is also the main decision zone for Monday.
22,602–22,739
This is the deeper liquidity zone marked on the chart. A sustained breakdown below 23,020 can bring this area into focus.
━━━━━━━━━━━━━━━━━━━━
OPENING SCENARIOS
🟢 GAP UP – 100+ POINTS
100-point gap-up reference: 23,227.60
If NIFTY opens above 23,228:
• Above 23,243 → watch 23,296
• Sustained above 23,296 → 23,371 → 23,527
• Rejection from 23,243–23,296 → avoid chasing longs and wait for confirmation.
🟡 FLAT / NORMAL OPEN
Reference range: 23,028–23,228
Wait for the first 15–30 minutes.
• Above 23,243 → strength toward 23,296
• Below 23,071 → weakness toward 23,020
• Inside 23,020–23,071 → NO-TRADE / WAIT FOR CONFIRMATION
🔴 GAP DOWN – 100+ POINTS
100-point gap-down reference: 23,027.60
If NIFTY opens below 23,028:
• Reclaim 23,020–23,071 → recovery can target 23,243
• Sustained below 23,020 → downside focus shifts toward 22,739–22,602
━━━━━━━━━━━━━━━━━━━━
TRADING APPROACH
✔ Don't trade the opening gap blindly.
✔ Wait for price acceptance/rejection at key levels.
✔ Prefer 15-minute closing confirmation for breakouts and breakdowns.
✔ Avoid aggressive option buying inside the 23,020–23,071 decision zone.
✔ Keep risk strictly controlled and avoid averaging losing trades.
━━━━━━━━━━━━━━━━━━━━
KEY MARKET MAP
Above 23,296 → Strength
23,020–23,296 → Decision / Range Zone
Below 23,020 → Weakness
━━━━━━━━━━━━━━━━━━━━
SUMMARY
The key battle for Monday is between 23,020–23,071 support and 23,243–23,296 resistance.
A sustained move above 23,296 can open the way toward 23,371 and 23,527.
A sustained breakdown below 23,020 can expose 22,739–22,602.
The focus should be on the market's reaction to these levels rather than predicting the opening direction.
DISCLAIMER
This analysis is for educational and informational purposes only. I am not a SEBI registered analyst. This is not investment advice or a recommendation to buy or sell any security or derivative. Trading in F&O involves substantial risk. Please conduct your own analysis and follow proper risk management.
#NIFTY50 #NIFTY #TradingPlan #IntradayTrading #TechnicalAnalysis #PriceAction #OptionsTrading #GoCharting #LiveTradingBox
The information and publications are not meant to be, and do not constitute, financial, investment, trading, or other types of advice or recommendations supplied or endorsed by GoCharting. Read more in the Terms of Use.
Related Analyses
Comments (0)
Loading comments…