Breakout Line + CPR )

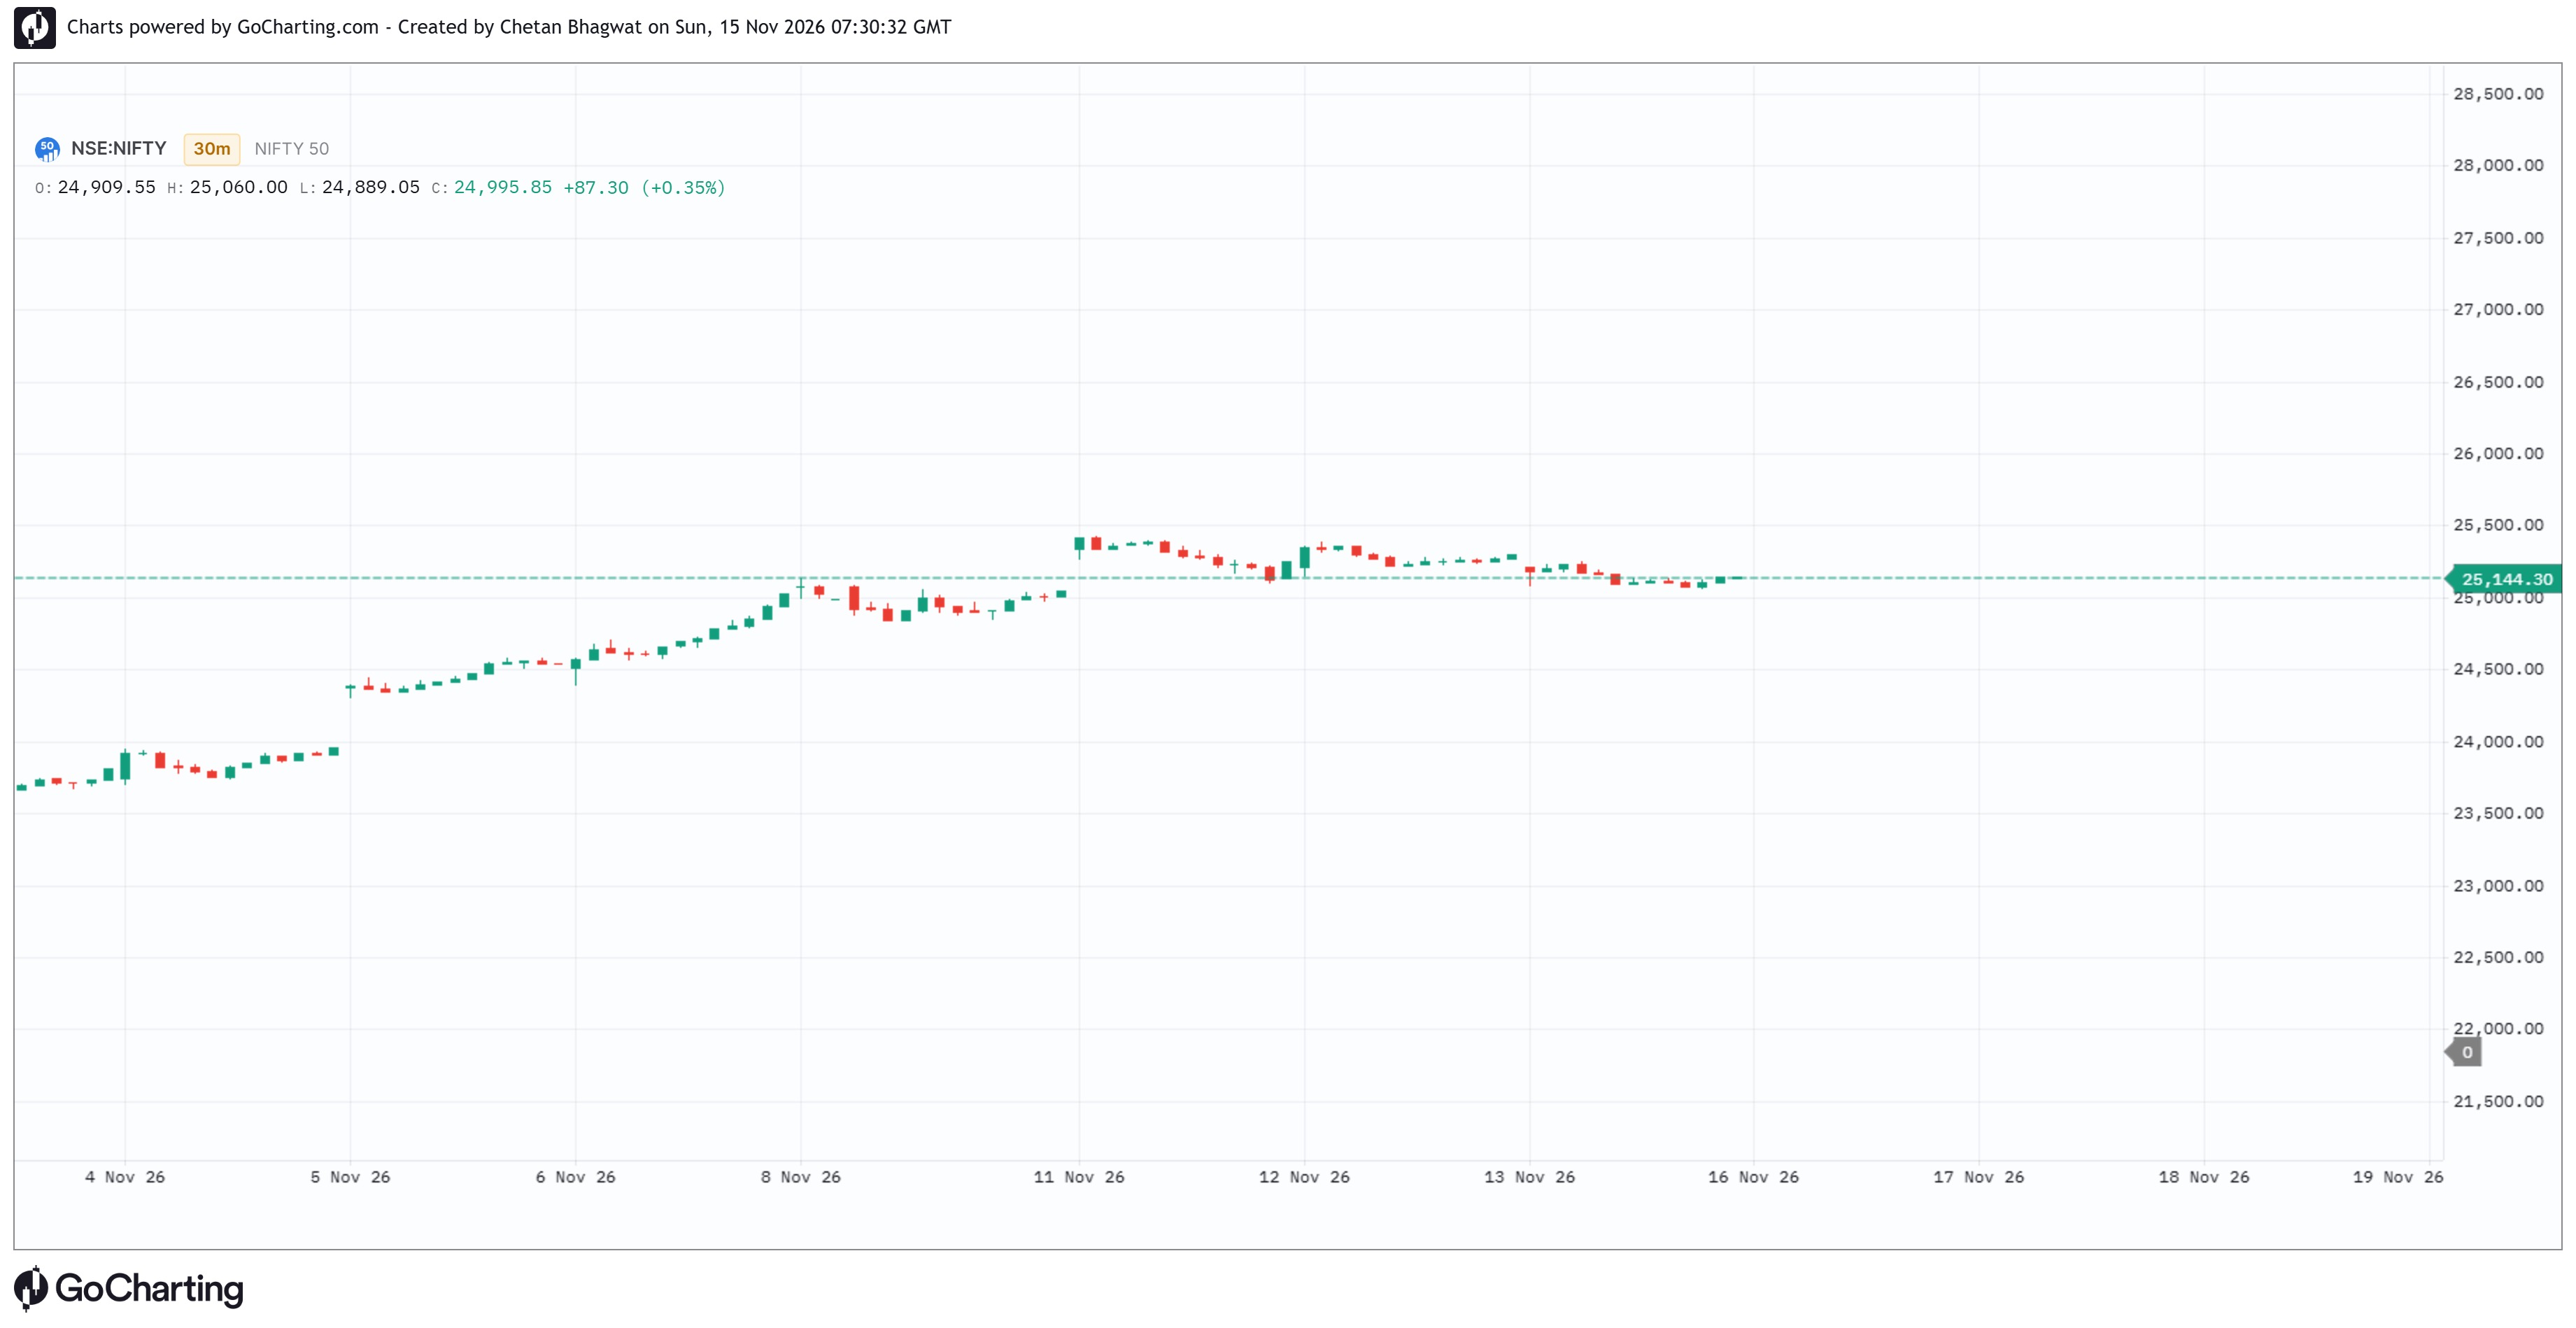
Displays rolling high and low levels over the user-selected lookback, with labels showing their current values. On 5-, 15-, and 30-minute intervals, it tracks the high and low reached from 9:15 to 9:35 in the Asia/Kolkata time zone, and plots reference lines at 0.09% above and below the 9:15 candle close. It also marks the previous bar’s high and low on intraday intervals, and plots selected moving averages on monthly or daily intervals. The pivot-level plots are always empty, and the breakout alert conditions are disabled. Settings control visibility, average lengths, line widths, breakout display options, and the lookback count.
The information and publications are not meant to be, and do not constitute, financial, investment, trading, or other types of advice or recommendations supplied or endorsed by GoCharting. Read more in the Terms of Use.
Comments (0)
Loading comments…