vivek awasthi IB+VC

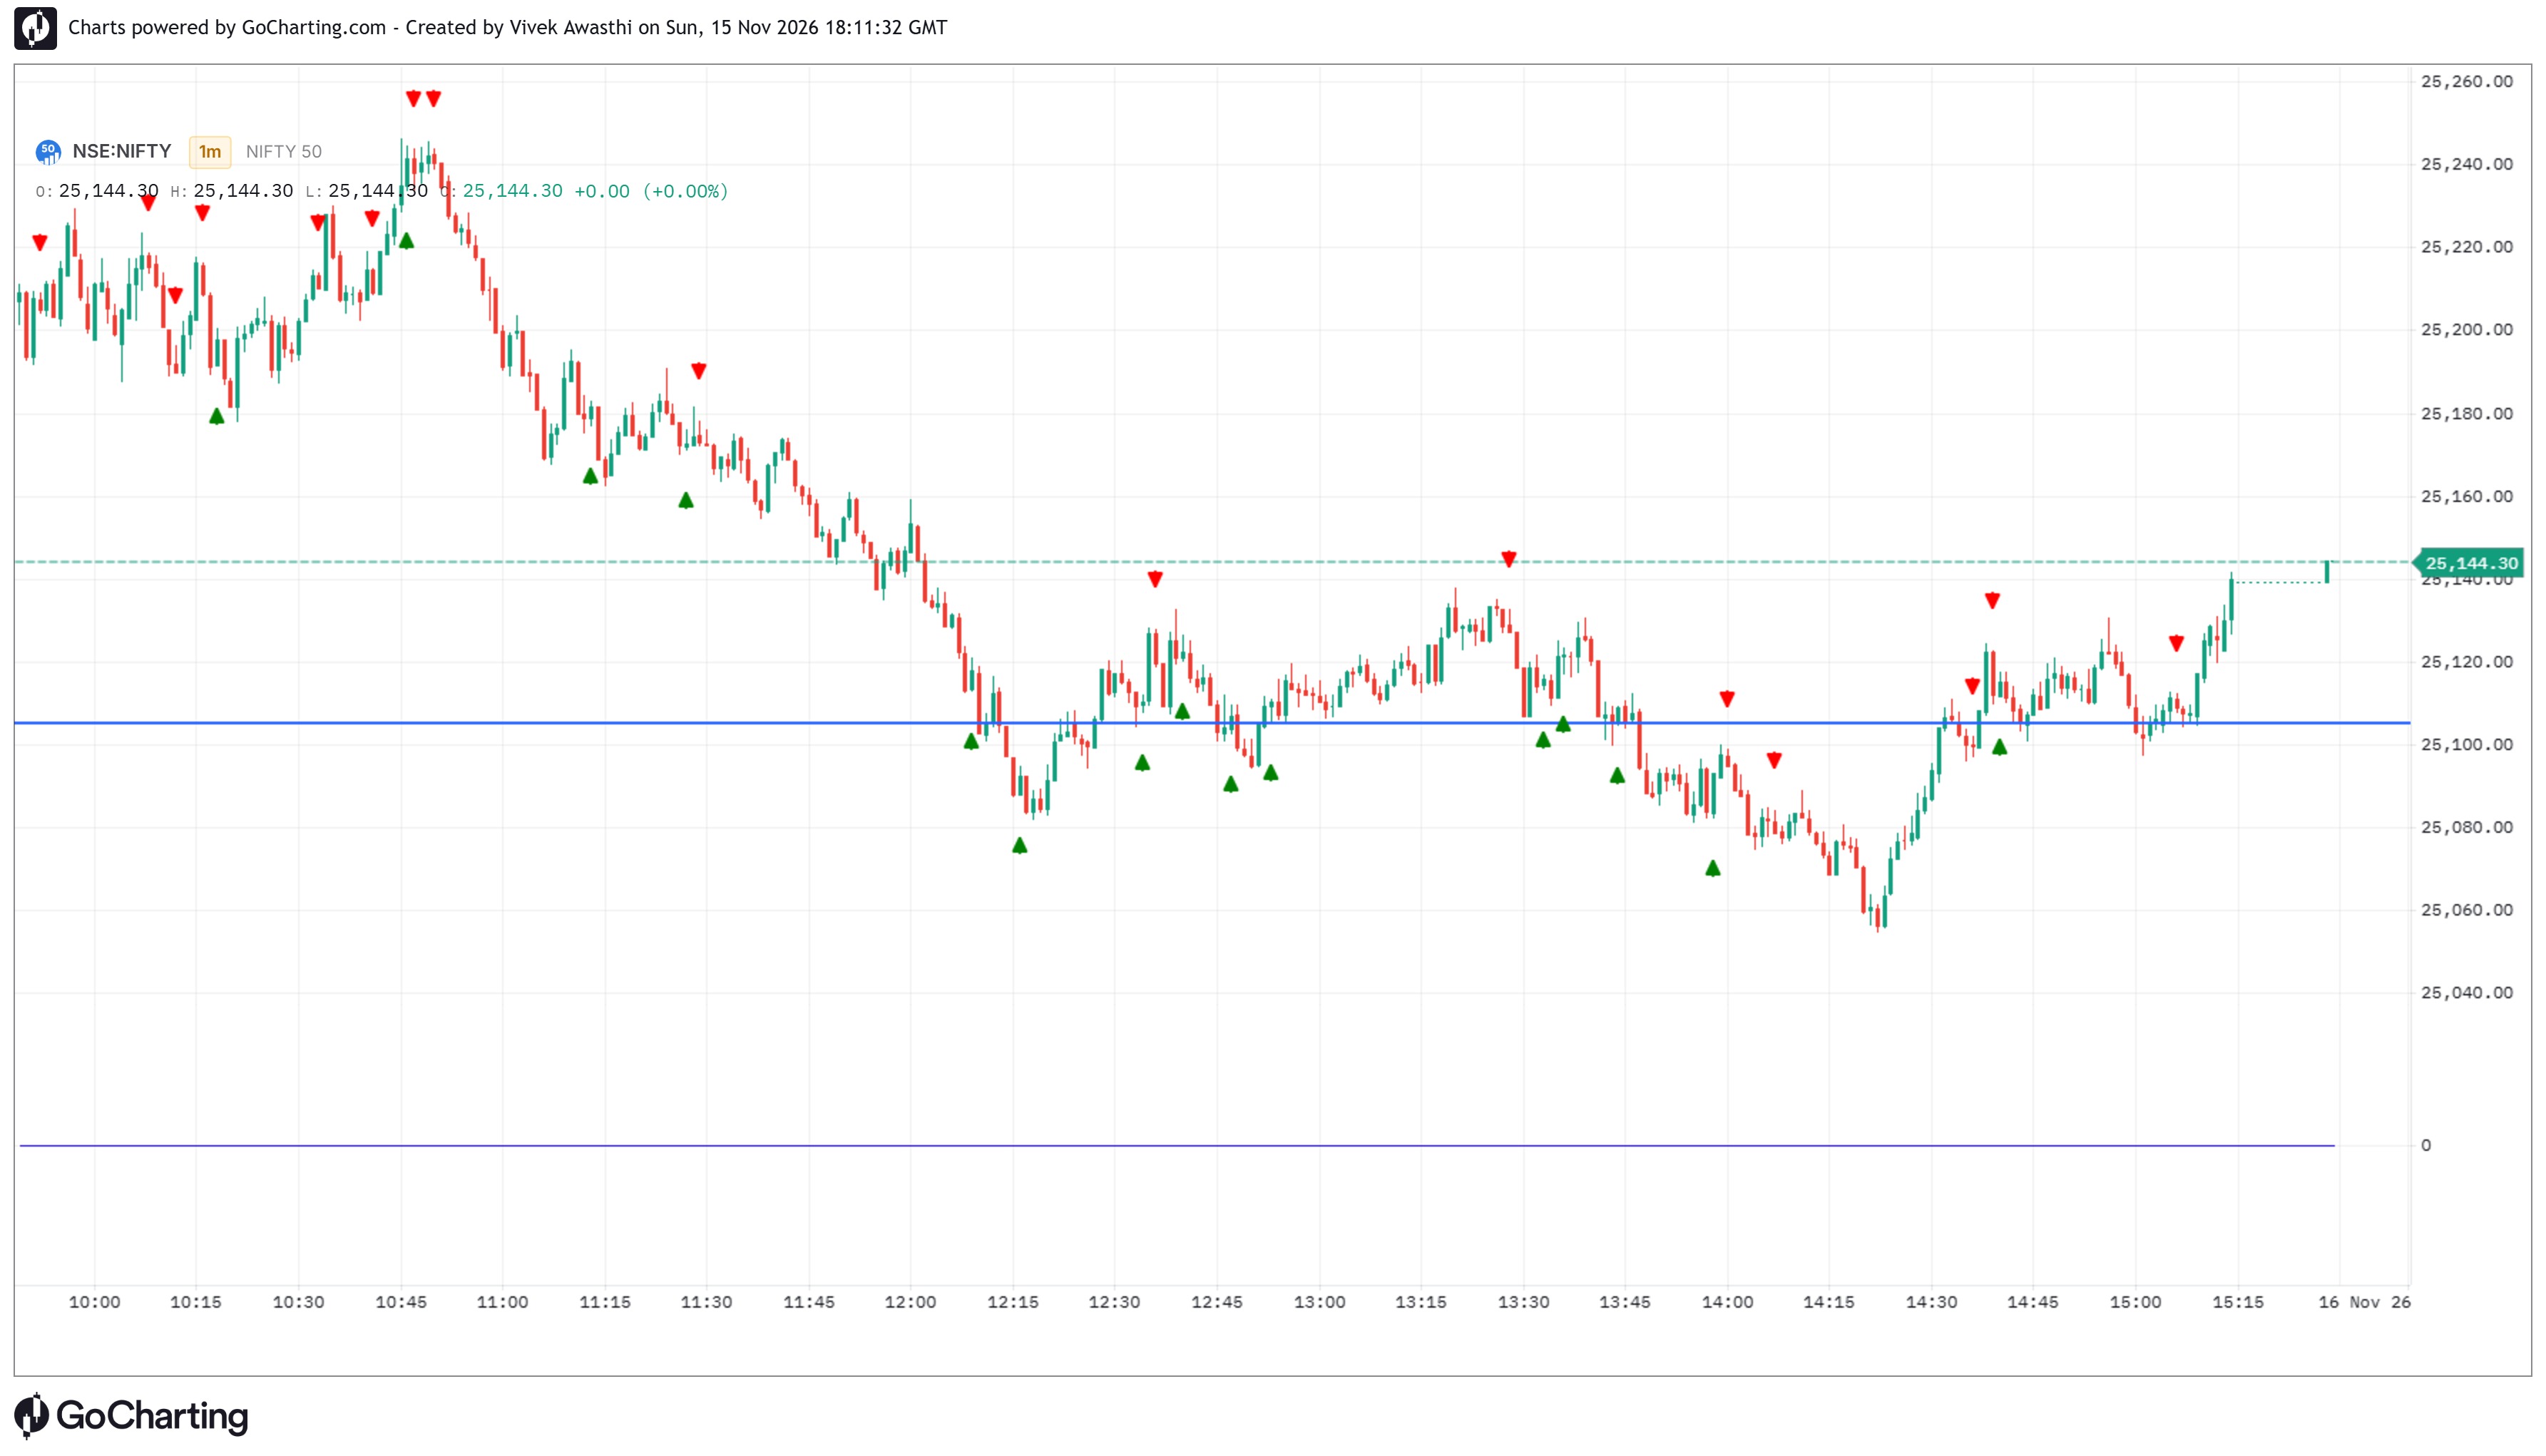
This indicator marks inside bars on the price chart when the previous bar’s range is greater than 80% of the 10-bar average range. Bullish inside bars receive a green upward arrow, while bearish inside bars receive a red downward arrow. It also marks bars where volume exceeds 1.8 times its 15-bar average and the candle body is no more than 40% of its range, using a pink circle. In a separate pane, it plots volume as a histogram colored by candle direction, plus an orange 15-bar volume average. The script has no user-adjustable settings.
The information and publications are not meant to be, and do not constitute, financial, investment, trading, or other types of advice or recommendations supplied or endorsed by GoCharting. Read more in the Terms of Use.
Comments (0)
Loading comments…