EVR | Effort vs Result

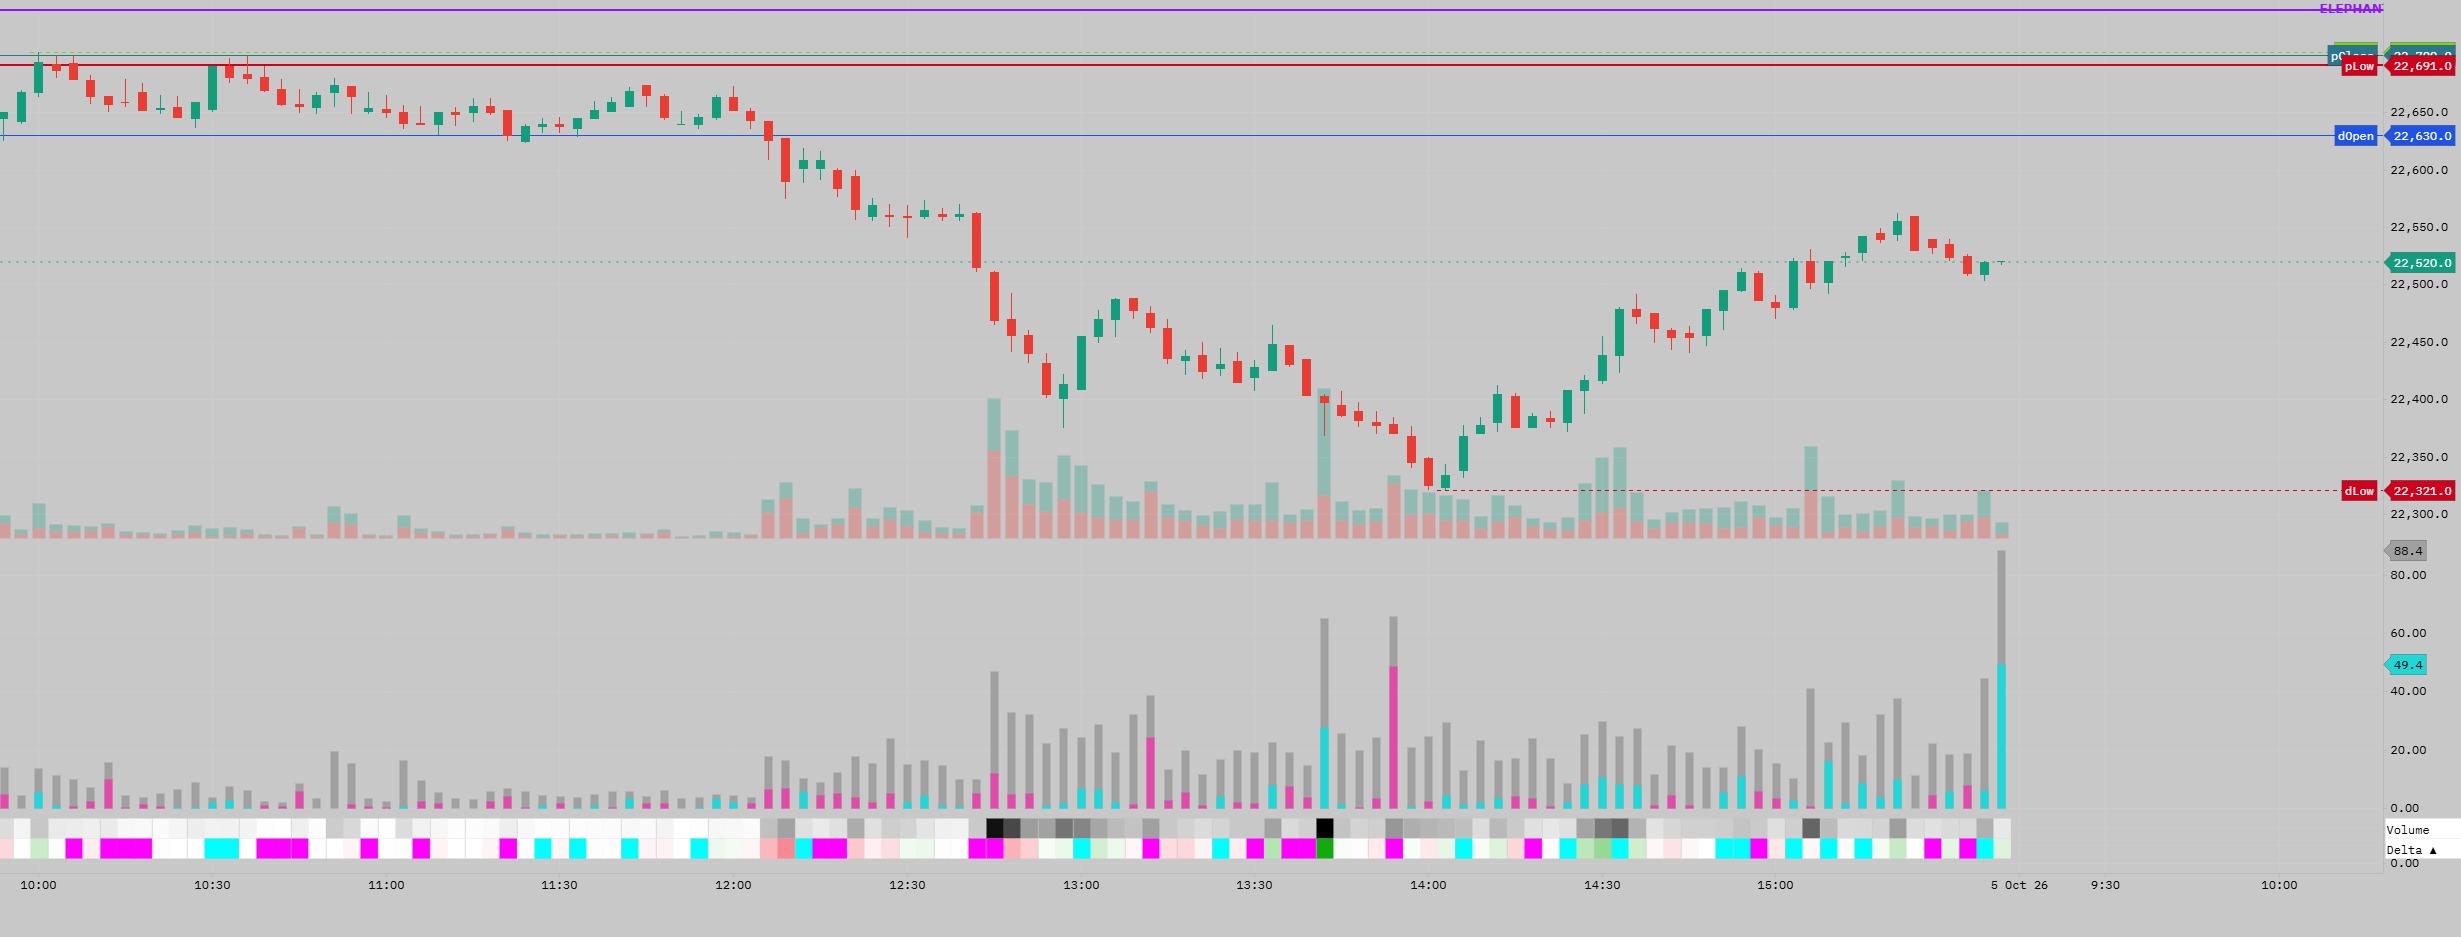
EVR | Effort vs Result
A simple order-flow indicator built around one question:
How much trading effort is required to produce the observed price movement?
EVR separates Total Effort from the Directional Effort generated by order-flow Delta.
EVR is not simply a volume indicator. It relates volume to the price range produced by that volume.
How it works
- Total Effort = Volume ÷ (High − Low)
- Directional Effort = |Delta| ÷ (High − Low)
- Delta Efficiency % = Directional Effort ÷ Total Effort = |Delta| ÷ Volume
The outer grey histogram represents Total Effort, while the inner turquoise/magenta histogram represents Directional Effort.
The relative size of the coloured portion within the Total Effort bar also provides a visual representation of Delta Efficiency.
A selectable Volume Base of 100 / 500 / 1K / 5K / 10K lets you adjust the numerical scale without changing the underlying relationship.
Meaning
- High EVR = relatively high effort (volume) is required to produce relatively little price movement.
- Low EVR = price is moving with relatively low effort (volume).
- Large coloured portion relative to the grey bar → high Delta Efficiency
- Small coloured portion relative to the grey bar → low Delta Efficiency
The three-layer interpretation
Bar height → Total Effort
Coloured bar height → Directional Effort
Coloured / total proportion → Delta Efficiency
High EVR
Price is expensive to move.
Then look at the coloured portion:
Large directional component
Much of the effort was one-sided.
Small directional component
Most of the effort was two-sided.
That combination is particularly revealing:
High EVR + small directional effort
→ Heavy fighting, churn, or conditions consistent with absorption.
High EVR + large directional effort
→ Strong aggression, but price is still expensive to move.
Low EVR + large directional effort
→ Efficient directional movement.
Low EVR + small directional effort
→ Price moving easily with relatively little directional commitment, potentially due to thin liquidity or a lack of opposing participation.
Two practical use cases
1. Deterioration after an extended move
When price has already travelled significantly and EVR suddenly rises, it means more effort is being required to produce further price movement.
This is not a reversal signal by itself, but it can be a useful risk-management cue to tighten stops and watch for confirmation such as CVD divergence or failure to extend.
2. Absorption and breakout quality
Around an important breakout level, high Total Effort with relatively little price progress can highlight conditions consistent with absorption.
This can occur just before the break, as aggressive participation struggles to push through the level, or immediately after the break, when heavy effort produces little follow-through.
A subsequent failure to extend can provide an early warning that the breakout is struggling to gain acceptance.
Conversely, a breakout with relatively low effort and strong directional effort suggests price is moving more easily.
EVR measures the effort. Price structure and other order-flow tools provide the context.
The information and publications are not meant to be, and do not constitute, financial, investment, trading, or other types of advice or recommendations supplied or endorsed by GoCharting. Read more in the Terms of Use.
Comments (2)
Loading comments…