4S-Smooth Structural Strength Score

This script's source code is protected by the author.
Smooth Structural Strength Score (SSSS)
Proprietary Market Leadership Model
Smooth
Structural Strength Score is a proprietary market leadership model designed to
identify securities exhibiting both strong long-term appreciation and efficient
directional behavior.
The indicator
is built on the premise that the strongest market leaders typically demonstrate
two characteristics:
1. Meaningful long-term price
advancement.
2. Consistent directional progress
with limited structural degradation.
Core
Framework
Long-Term
Performance Component
The model
evaluates annualized price advancement through a rolling weekly performance
framework.
This component
measures whether an asset has demonstrated sufficient long-term appreciation to
qualify as a potential leadership candidate. Securities lacking meaningful
long-term progress are naturally penalized regardless of short-term strength.
Directional
Efficiency Component
Price
appreciation alone does not necessarily indicate a healthy trend.
The indicator
therefore incorporates a proprietary efficiency factor designed to evaluate how
effectively price has progressed toward its current level.
Assets reaching
new highs through relatively organized and persistent directional movement
receive higher efficiency readings.
Assets reaching
similar returns through excessive volatility, repeated reversals, or unstable
price action receive lower efficiency readings.
Structural
Strength Score
The final score
is generated by combining long-term performance with directional efficiency.
This approach
seeks to identify securities that are not only appreciating but doing so
through stable and constructive market behavior.
As a result,
the model favors assets displaying characteristics commonly associated with
sustained leadership while filtering out many low-quality advances driven
primarily by short-term speculation or erratic movement.
What the
Indicator Shows
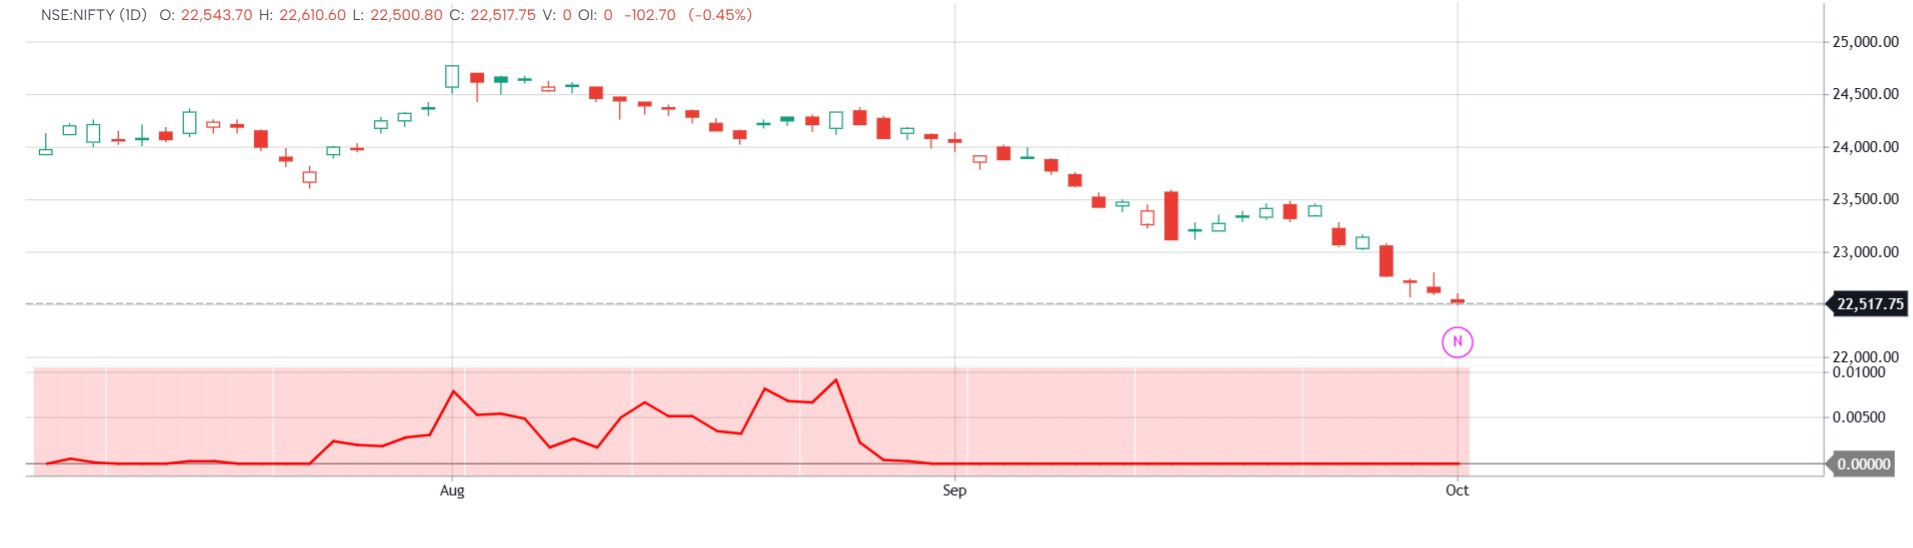
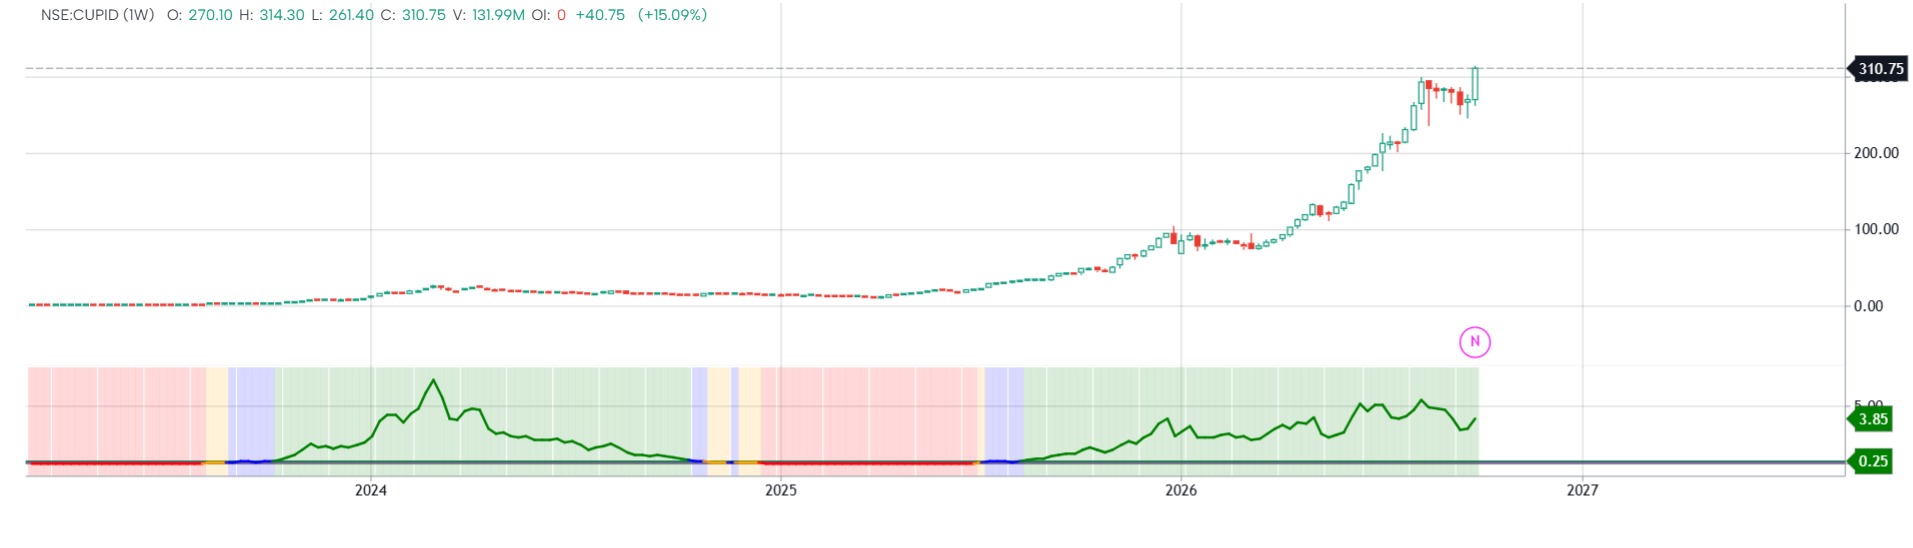
The indicator
classifies stocks into four categories:
● Leadership Zone — Score Value > 0.25
Strongest stocks in the market.
Clear and sustained uptrends.
Potential candidates for position trading
and long-term trend following.
● Trend Zone — Score Value Between 0.15 to 0.25
Stocks with healthy upward momentum.
Positive trend structure remains intact.
Suitable for trend-following strategies.
● Choppy Zone — Score Value 0.05 to 0.15
Mixed or inconsistent price behaviour.
Lack of clear directional conviction.
Requires additional confirmation before
taking positions.
● Noise Zone — Score Value 0 to < 0.05
Weak market structure.
Lack of sustained trend.
Generally avoided by trend-following
investors.
How to Use
It
· Focus on stocks moving into the
Leadership or Trend zones.
· Continue holding positions
while the stock remains in a strong category.
· Use price action and risk
management tools to manage exits.
· Avoid making decisions solely
based on short-term market noise.
Key
Benefits
· Quickly identifies market
leaders
· Helps filter out weak and
sideways stocks
· Supports systematic stock
selection
· Useful for momentum and
trend-following investors
· Easy visual classification
using color-coded zones
Ideal For
· Position Traders
· Swing Traders
· Momentum Investors
· Portfolio Managers
· Relative Strength Investors
The objective
of the Structural Strength Score is simple: identify stocks exhibiting strong,
persistent trends and avoid stocks lacking clear direction.
The information and publications are not meant to be, and do not constitute, financial, investment, trading, or other types of advice or recommendations supplied or endorsed by GoCharting. Read more in the Terms of Use.
Related Scripts
Comments (0)
Loading comments…