HKS Trend Channels with Volume-Based Demand and Supply

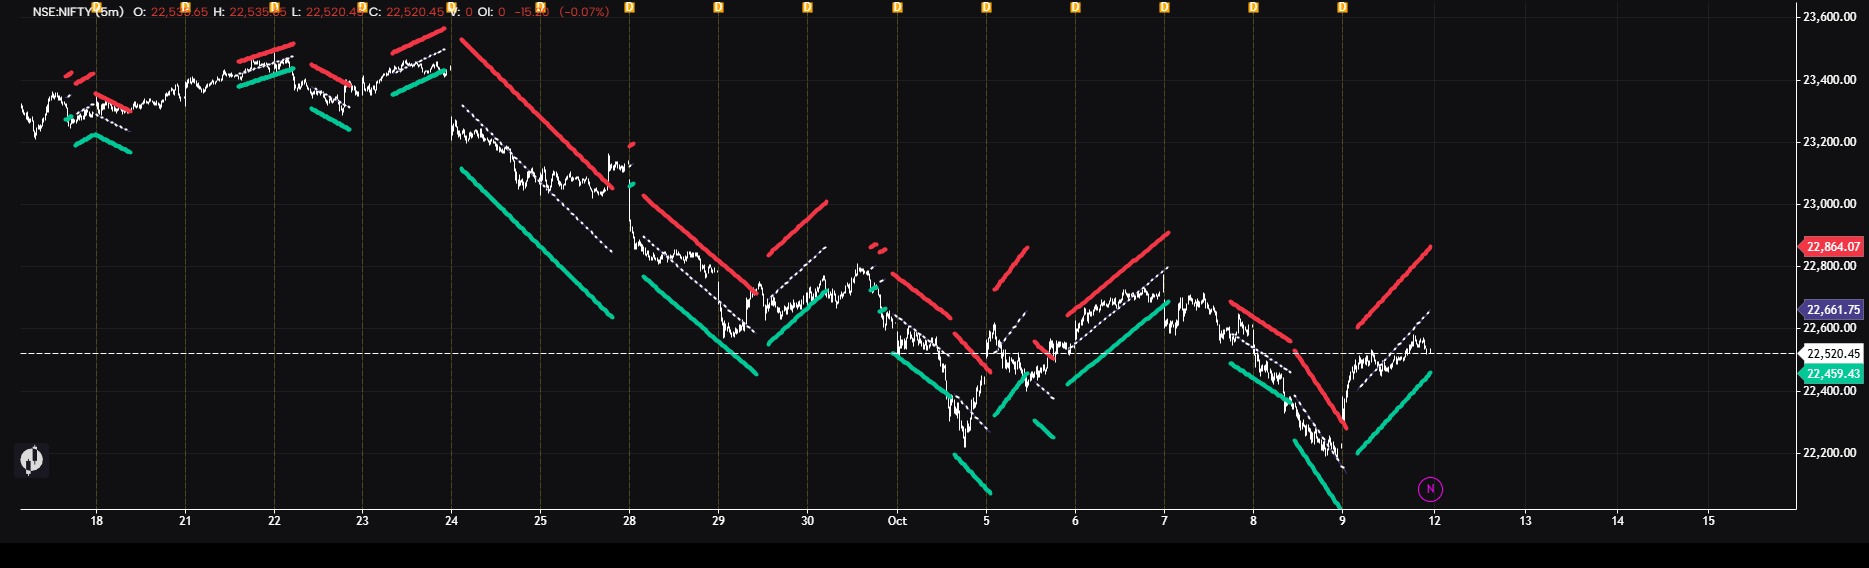
A chart overlay that combines sloping trend channels with volume-based demand and supply zones. It helps you see trend direction, identify areas formed by high-volume candles, and track previous support and resistance after a breakout.
Description
The indicator includes:
Trend channels: Red upper boundaries, green lower boundaries, and a dashed white midpoint. Channels use SMA-based trend detection and ATR-based width.
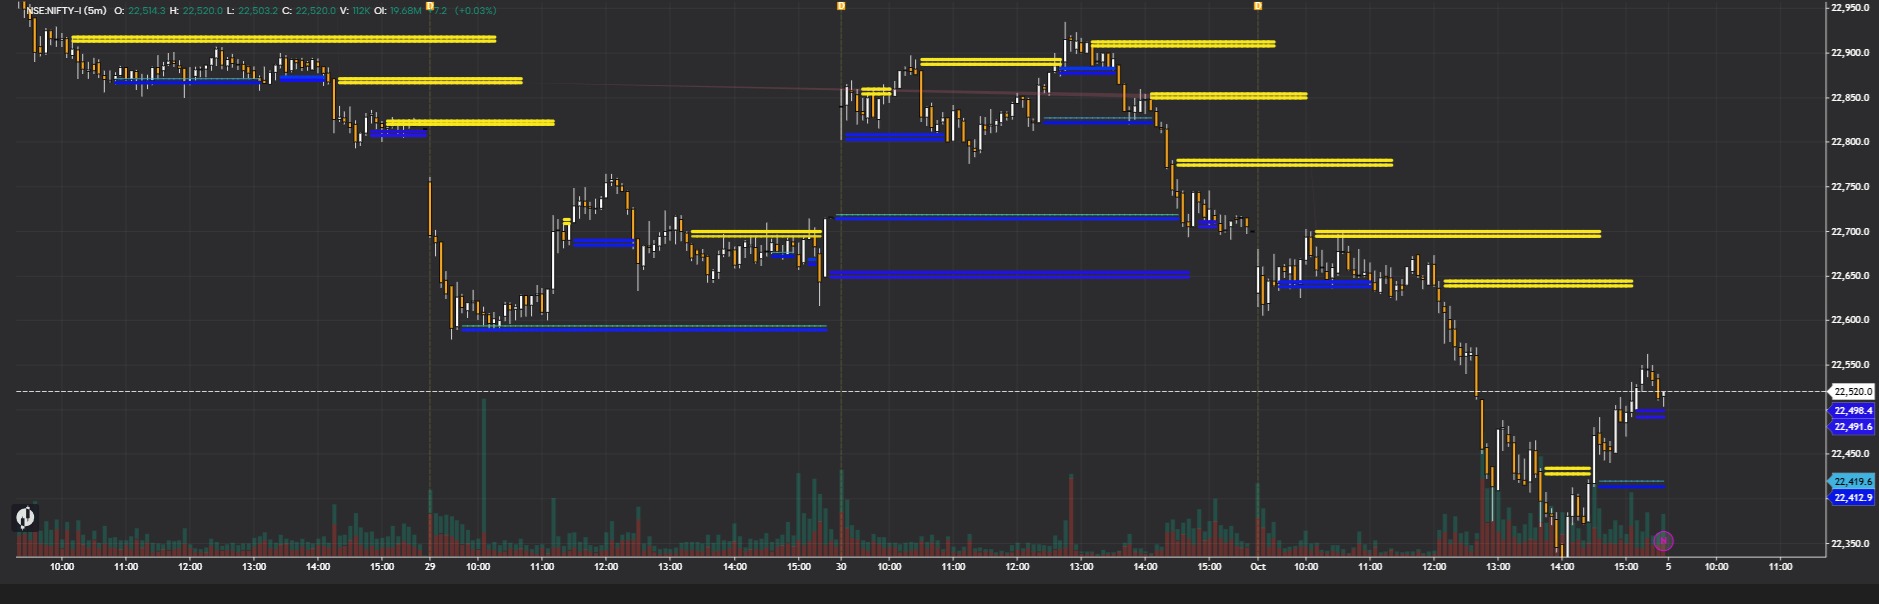
Volume-based zones: Blue demand/support zones near qualifying candles’ lows and orange supply/resistance zones near their highs.
Volume filtering: By default, a qualifying candle must exceed 1.5 times the preceding average volume and match or exceed the highest volume in the preceding 50-bar window.
Broken-level tracking: After a candle closes beyond a zone’s outer boundary, a thin horizontal line preserves that price. The latest three broken demand levels and three broken supply levels extend forward as new bars appear.
Adjustable settings: Customize trend sensitivity, channel width, volume filters, zone thickness, and zone lifetime.
The script uses the current chart timeframe. Volume zones are calculated from completed candles and require a symbol with volume data. They represent high-volume price areas—not actual resting orders or order-book liquidity.
Adapted from Flux Charts original trend-channel logic, with volume-zone and broken-level features added for GoCharting Lipi. This is a chart-analysis tool, not a standalone buy or sell signal.
The information and publications are not meant to be, and do not constitute, financial, investment, trading, or other types of advice or recommendations supplied or endorsed by GoCharting. Read more in the Terms of Use.
Related Scripts
Comments (0)
Loading comments…