• Products
    TOOLS
    Trading and Charting TerminalAdvanced Technical Analysis And Orderflow Charting
    Options DeskOptions Chain, Strategy Builder, Greeks, IV
    Options ScalperRisk Managed Execution Module
    MARKETS
    Stocks & ETFs
    Futures
    Crypto
    CFDs/FX
    Prediction MarketsNEW
    CALENDARS
    Economic CalendarFX events, interest rates & macro data
    Predictions CalendarNEWUpcoming prediction market resolutions by expiry
  • Features
    PLATFORM
    ChartingChart types, indicators & Lipi scripting
    Order FlowFootprint, Market Profile, Volume Delta, DOM
    TradingOne-click trading, bracket orders & ScalPro
    OptionsOptions chain, strategy builder & GEX
    Prediction MarketsNEWCharts, calendar & heatmap for event contracts
    LipiCustom scripting language for indicators
    COMMUNITY & MORE
    AnalysesCommunity driven analysis & education
    ScriptsCommunity scripts & custom indicators
    WatchlistsCurated & community symbol watchlists
    GoChamp challengesFree weekly trading competitions & prizes
  • Trading
    TRADING
    Trading HubBrokers, market data & live execution
    BrokersConnect your broker for live trading
    Market DataReal-time & historical data subscriptions
    MARKET DATA
    🇺🇸CME Futures/ES, /NQ, /CL, /GC & more🇮🇳NSENIFTY, BANKNIFTY & F&O data🇮🇳MCXGold, Silver, Crude Oil futures
    🇺🇸Nasdaq SoonNYSE & NASDAQ equities
    💱CFDs/FXLive CFD and FX prices₿CryptoBinance, Bybit & Coinbase data
  • Pricing
  • Resources
    EducationCourses, tutorials & trading videos
    BlogTrading insights & market analysis
    DocumentationPlatform guides and API reference
    DevelopersSDK, libraries & open source projects
    FAQFrequently asked questions
    AboutOur mission, team and story
    CareersJoin the GoCharting team
  • For Business
    AI Charting LibraryFREEEmbed GoCharting free, or white-label it
    Broker IntegrationConnect your brokerage to GoCharting
    Education ProgramPartner with us to teach traders
    AffiliatesEarn by referring traders
    All partnerships →Talk to us: [email protected]
Products

TOOLS

Trading and Charting TerminalAdvanced Technical Analysis And Orderflow ChartingOptions DeskOptions Scalper

MARKETS

Stocks & ETFsFuturesCryptoCFDs/FXPrediction MarketsNEW

CALENDARS

Economic CalendarPredictions CalendarNEW
Features
ChartingOrder FlowTradingOptionsPrediction MarketsNEWLipiAnalysesScriptsWatchlistsGoChamp challenges
Trading
Trading HubBrokers

MARKET DATA

🇺🇸 CME Futures🇮🇳 NSE🇮🇳 MCX🇺🇸 NasdaqSoon💱 CFDs/FX₿ Crypto
Pricing
Resources
EducationBlogDocumentationDevelopersFAQAboutCareers
For Business
AI Charting LibraryFREEBroker IntegrationEducation ProgramAffiliates
← All Scripts

NY Session Map: Initial Balance + Liquidity Sweeps [Aurabot]
Open sourceOpen source. Anyone can read and copy the source code.
AuraBot | AuraSzn
AuraBot | AuraSzn
@AuraBot · 1w ago
NY Session Map: Initial Balance + Liquidity Sweeps [Aurabot]
Add to chart

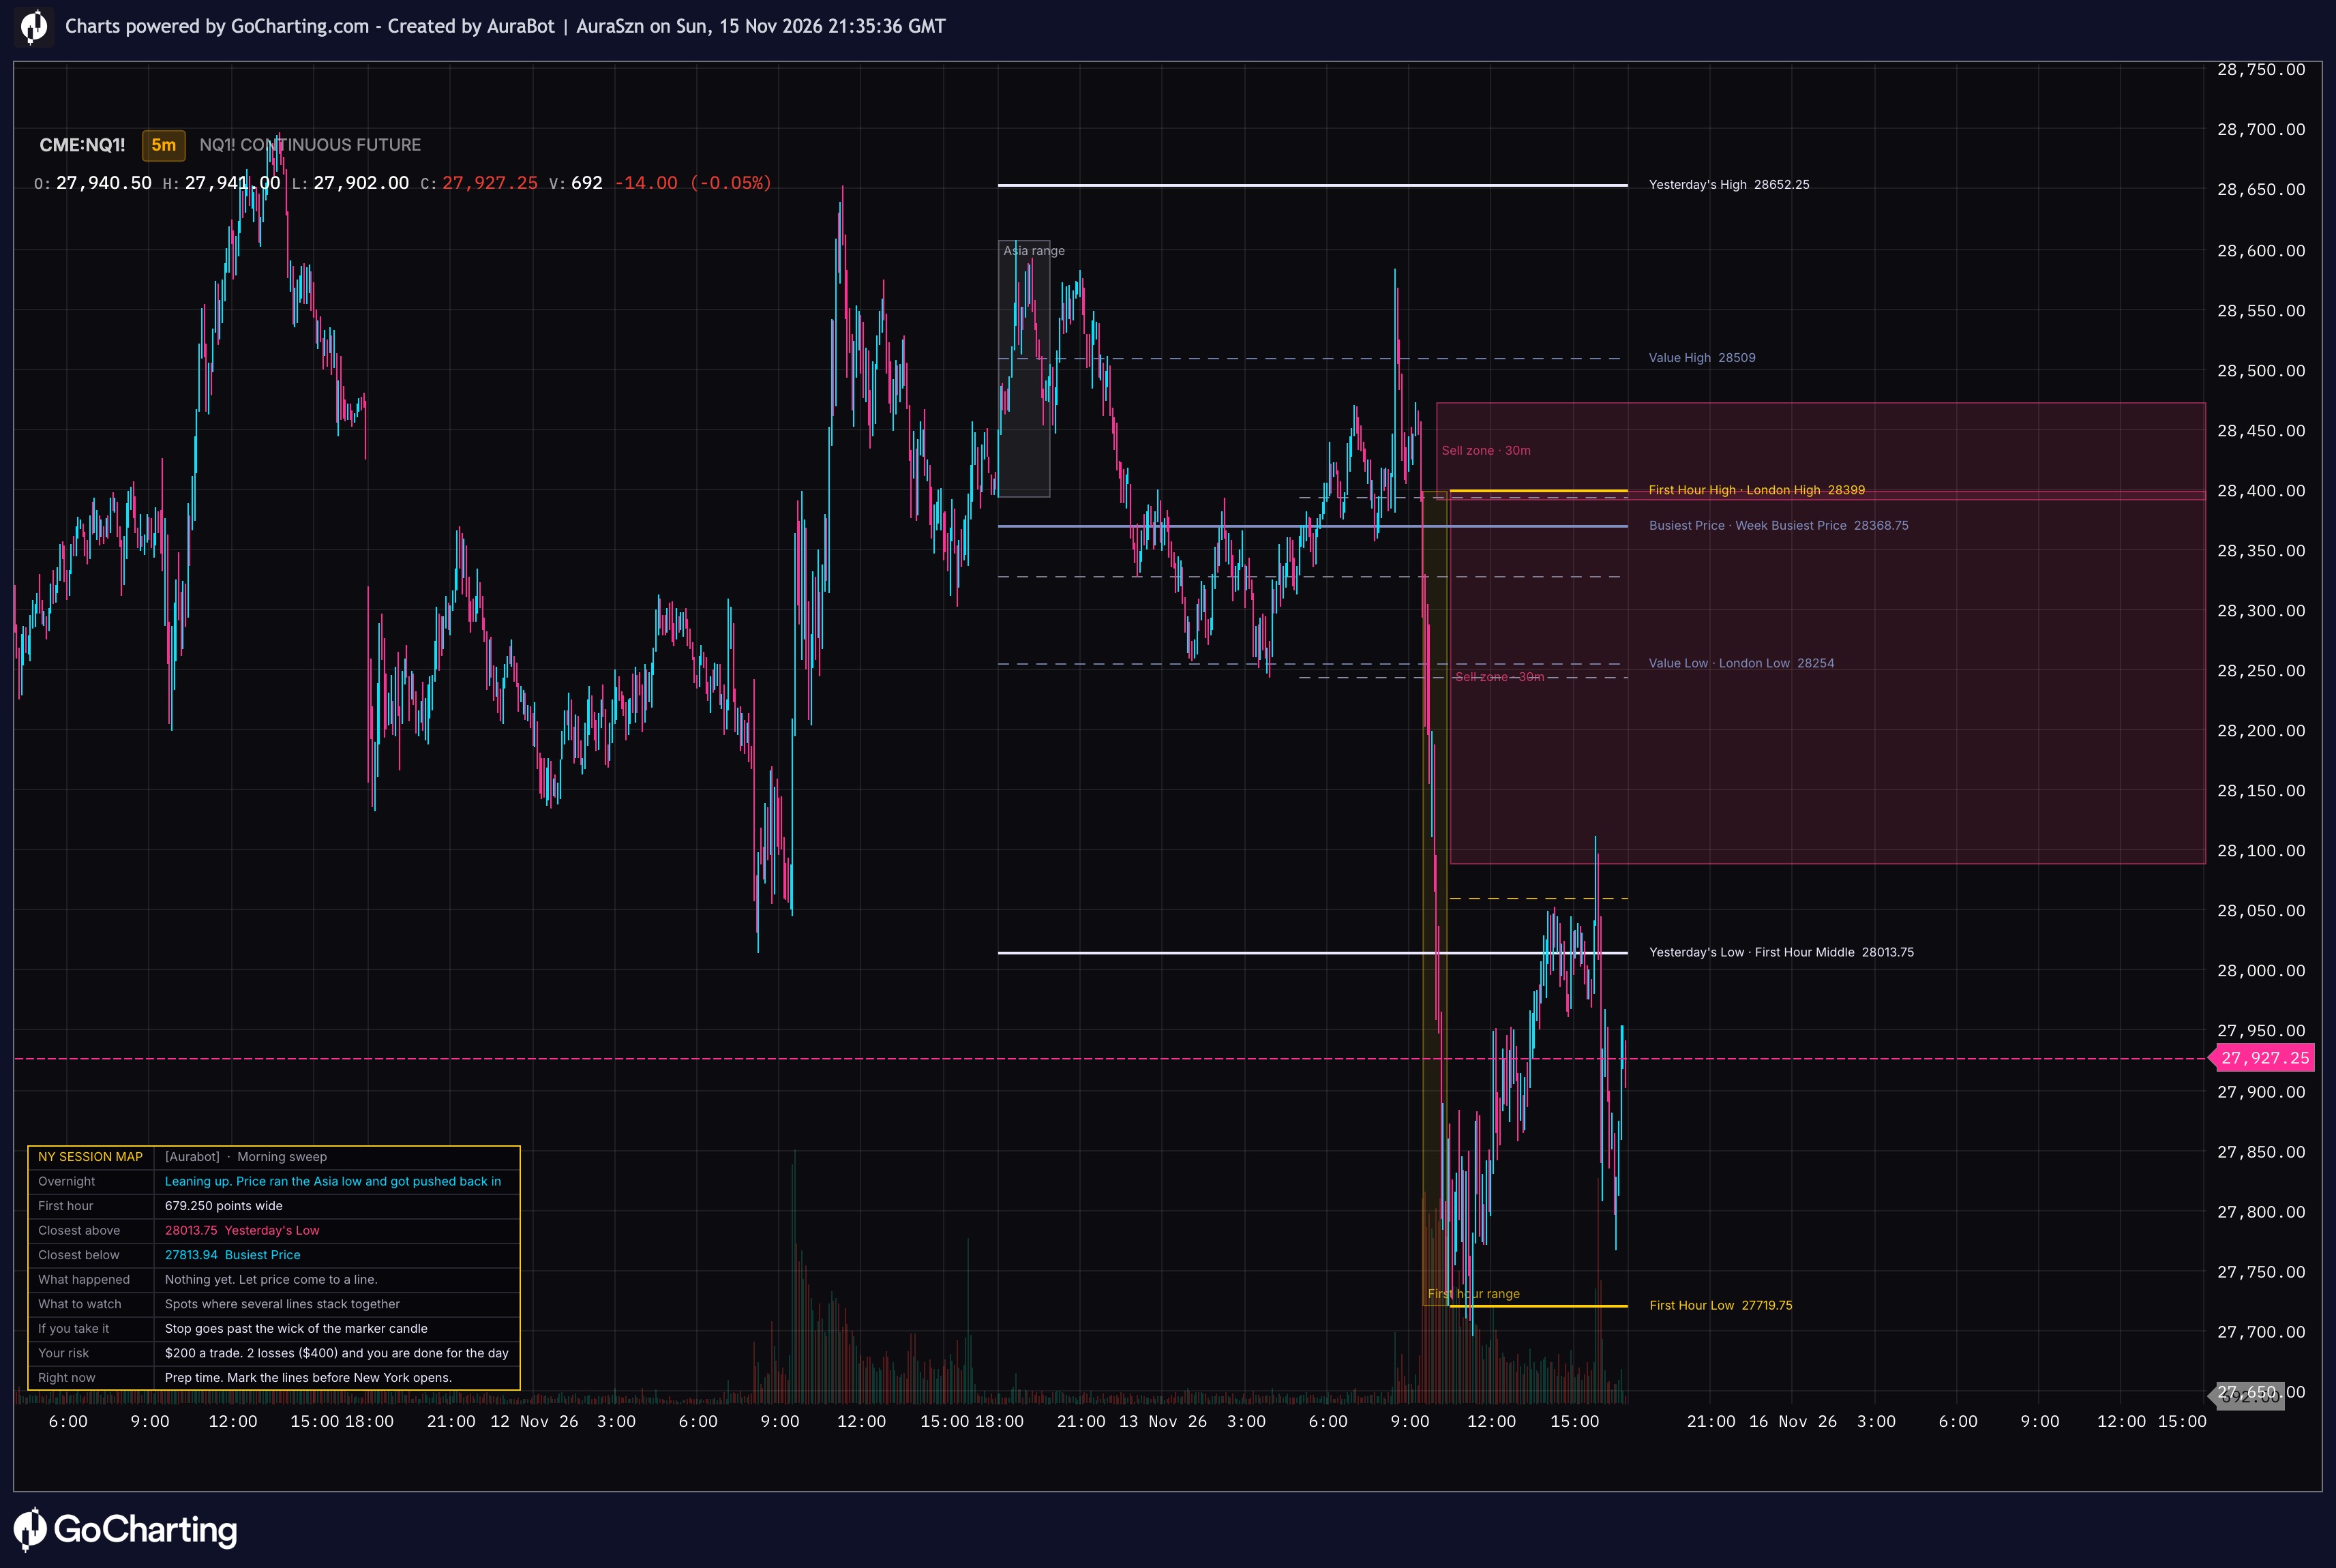
NY Session Map puts the lines New York session traders draw by hand on the chart for you, names them in plain English, and explains what price is doing in a small panel. Built for NQ and Gold on 1 to 30 minute charts.

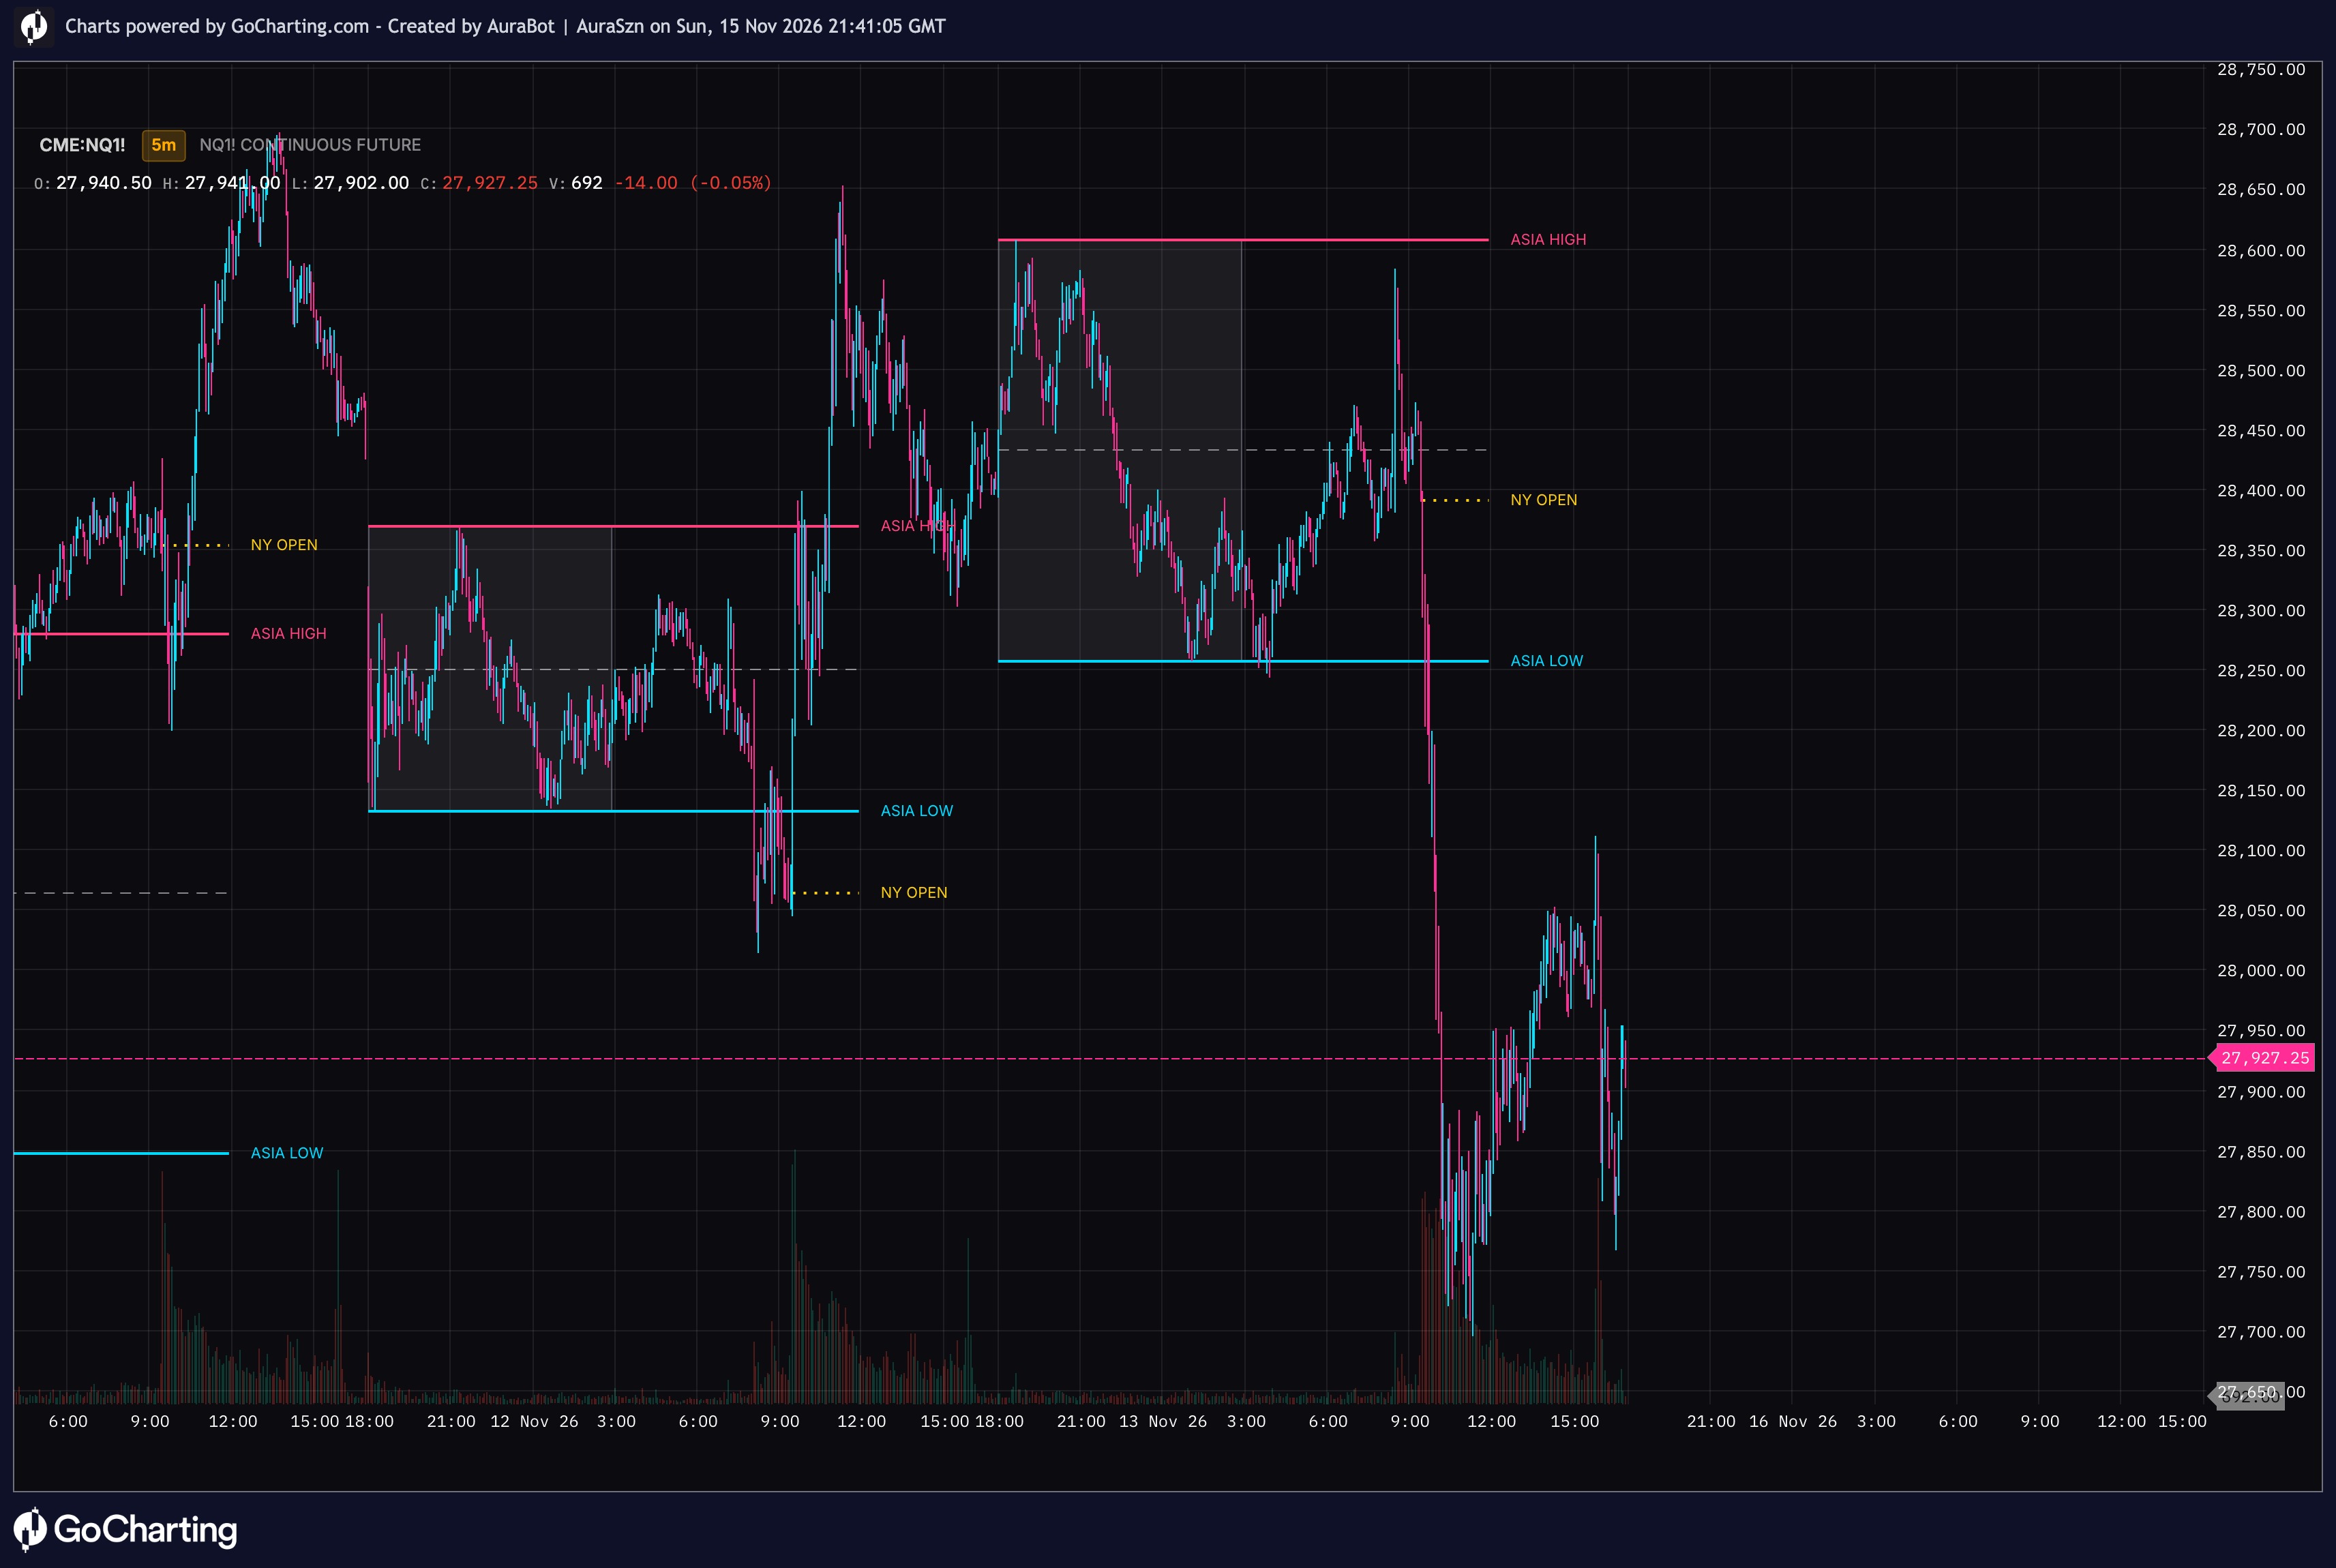
WHAT IT DRAWS: Yesterday's High and Low. Yesterday's value area (Value High, Busiest Price, Value Low) and last week's value area. London High and Low. The Asia range. The First Hour range (Initial Balance, 9:30 to 10:30 ET) with its high, middle and low. Recent 30 minute buy and sell zones.

WATCH SPOTS: Morning sweep (default) tags 9:40 to 10:30 ET when price runs the Asia or overnight high or low and closes back inside. First hour playbook tags failed breakouts and middle holds after 10:30. A watch spot is a place to look, not a signal. In our own 4 year test, taking them blindly did not make money after costs. Your read decides.

THE PANEL: overnight lean, first hour width, closest lines above and below, what happened, what to watch, stop and size for your dollar risk, and your daily loss limit.

SETTINGS: 16 AuraBot color themes plus Custom, clean text labels or colored tags, text size, panel position, past days, every session time, value area %, zone size and risk numbers. Same script as the TradingView version, rebuilt for GoCharting.

Times are New York time. Educational tool only, not financial advice.

Tagsinitial balanceliquidity sweepNQgoldNew York sessionkey levelsAurabot
Disclaimer

The information and publications are not meant to be, and do not constitute, financial, investment, trading, or other types of advice or recommendations supplied or endorsed by GoCharting. Read more in the Terms of Use.

Related Scripts
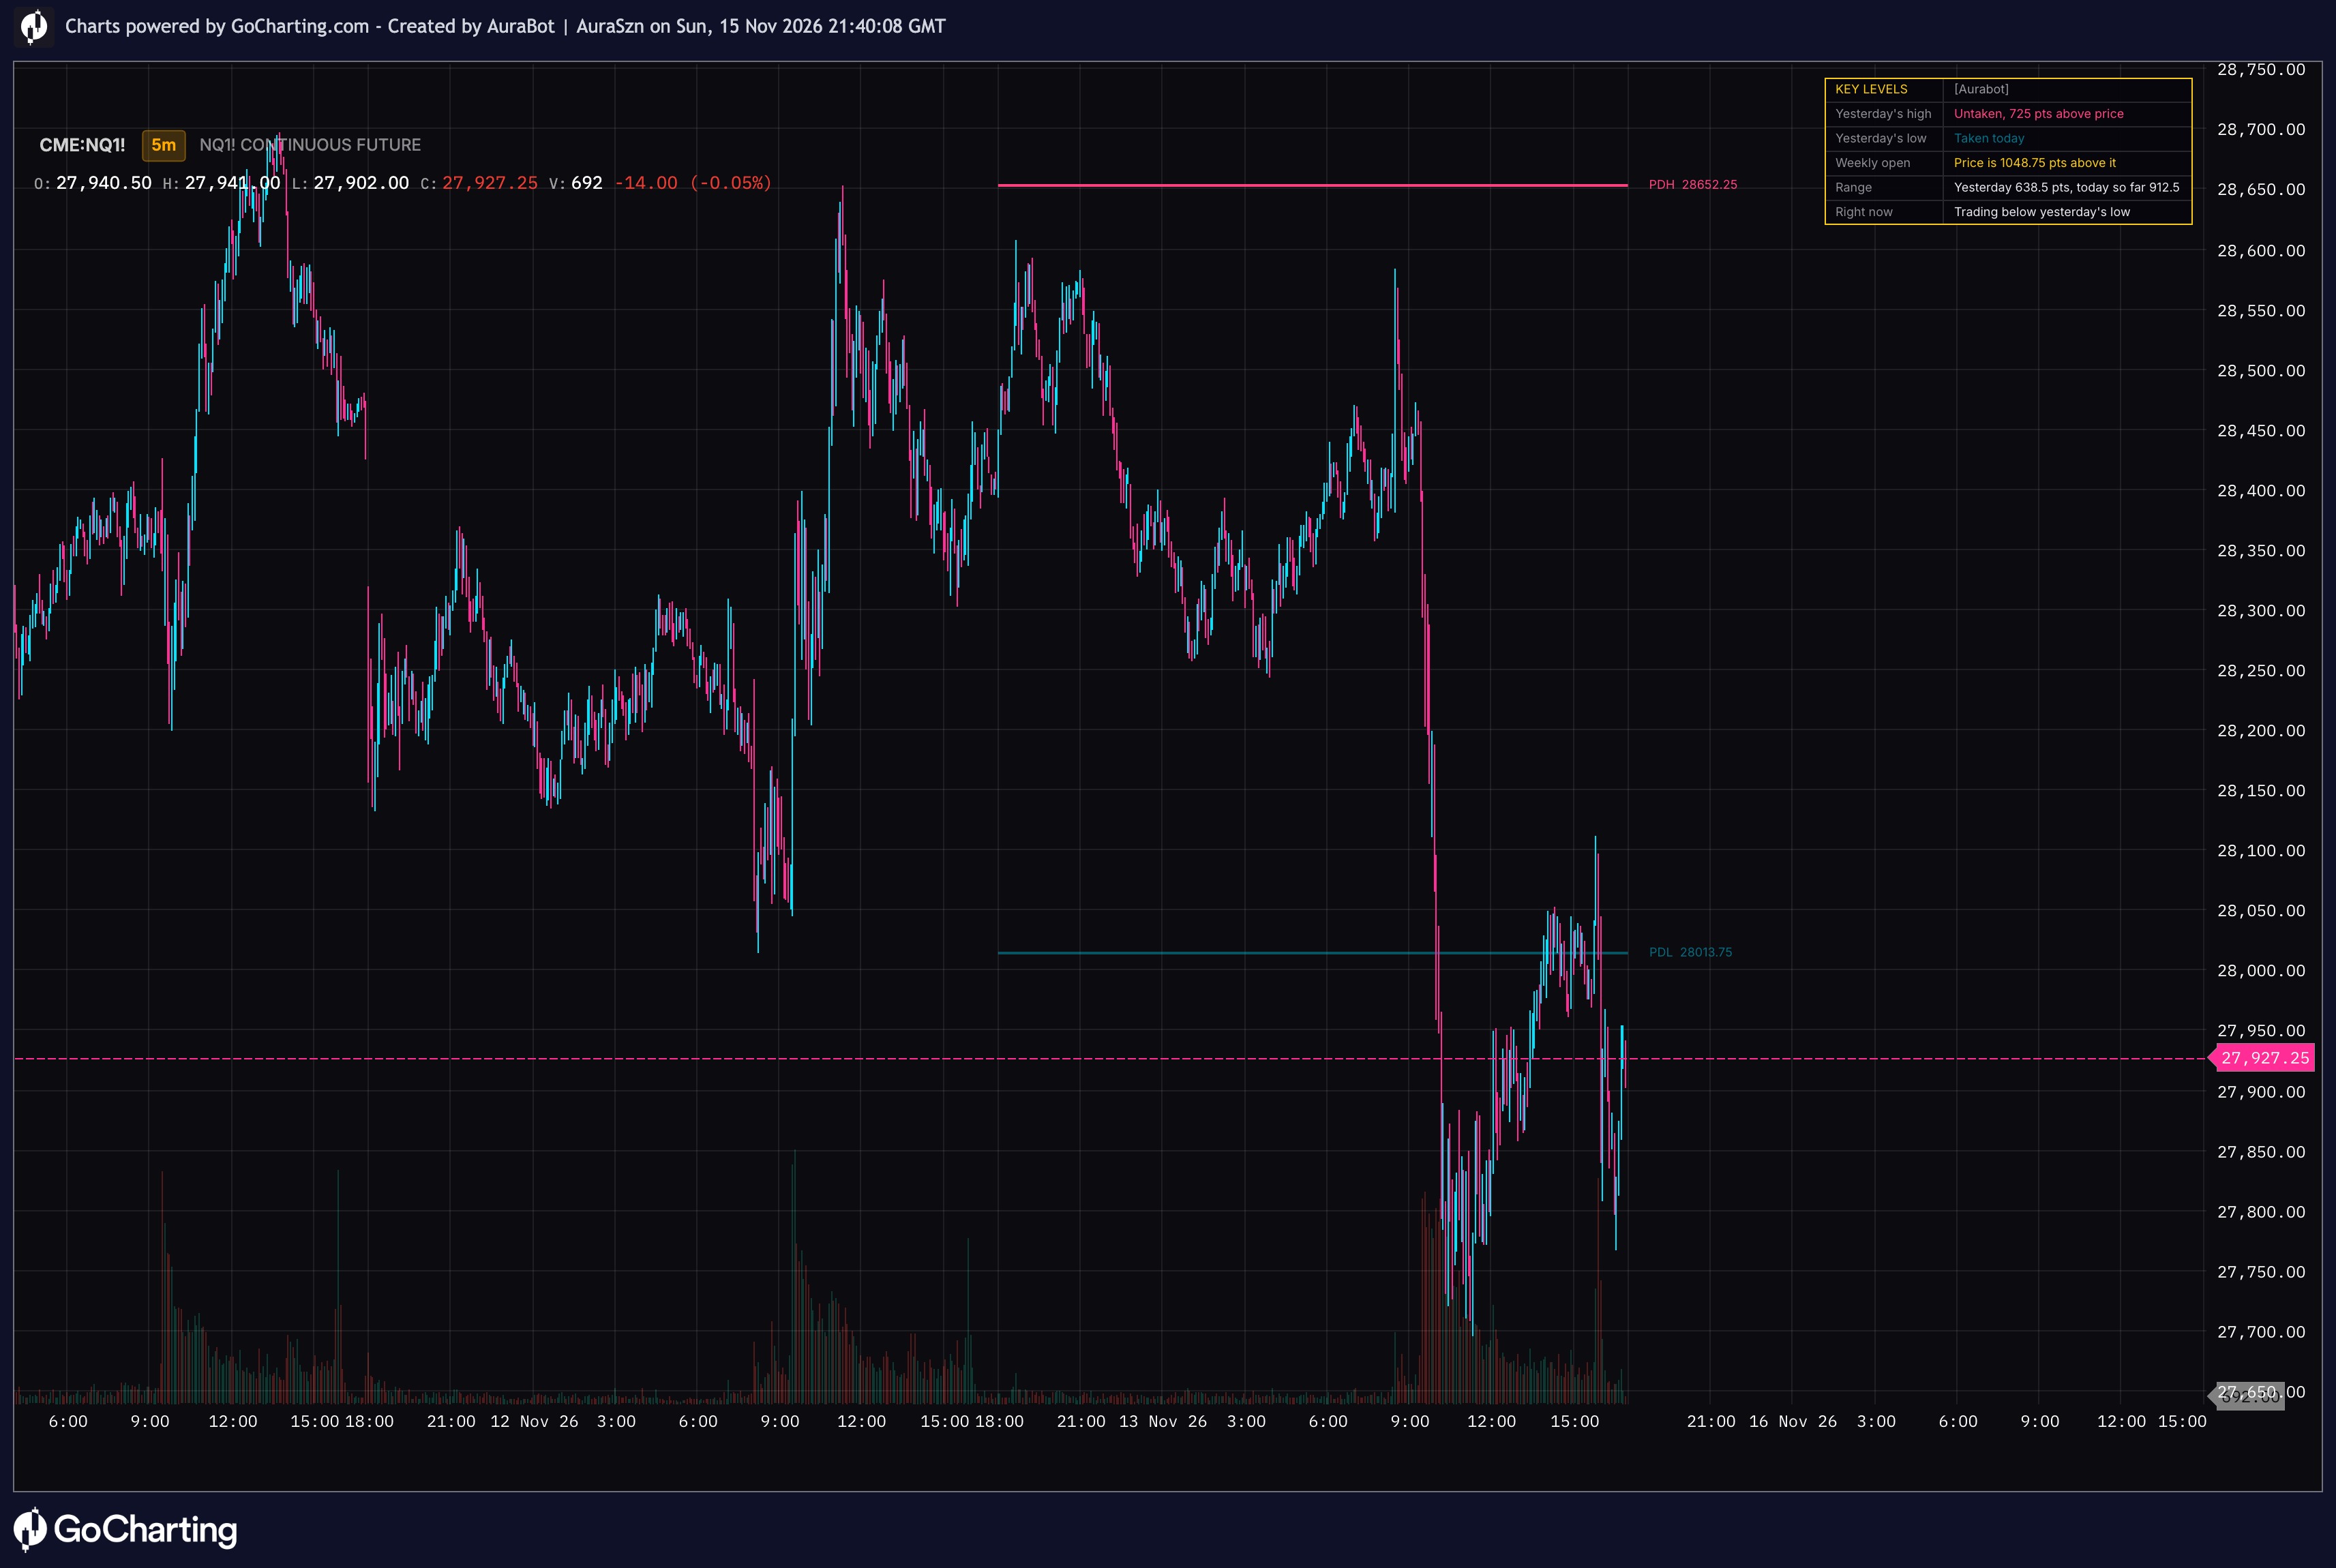
Key Levels: Previous Day High/Low + Weekly Open [Aurabot]
AuraBot | AuraSznAuraBot | AuraSzn
1
Asia Range [Aurabot]
AuraBot | AuraSznAuraBot | AuraSzn
1

Comments (1)

Loading comments…

Product

  • Charts
  • Options Desk
  • Scalper
  • Economic Calendar
  • Predictions CalendarNEW
  • Community
  • Watchlists
  • Workspaces
  • Challenges
  • Market Data
  • All Brokers
  • Pricing
  • Features

Developers

  • Library SDK DocumentationFREE
  • Lipi Scripting
  • Lipi Reference
  • GoCharting Documentation
  • Open Source

Partnerships

  • AI Charting Library
  • Broker Integration
  • Education Program
  • Affiliates

Resources

  • Education
  • Download
  • Blog
  • FAQ
  • Contact

Legal

  • About
  • Careers
  • Privacy Policy
  • Terms & Services
  • Refund & Cancellation
  • Affiliate Terms
  • GoChamp
  • Sitemap

Markets

  • All Markets
  • Stocks & ETFs
  • Futures
  • Options
  • Crypto
  • CFDs/FX
  • Prediction Markets

©2026, GoCharting INC.

GoCharting is a professional orderflow charting and trading platform trusted by 3M+ traders worldwide. Access Market Profile, Footprint Charts, Options Desk, and real-time data across stocks, futures, forex, and indices.