FVG Indicator

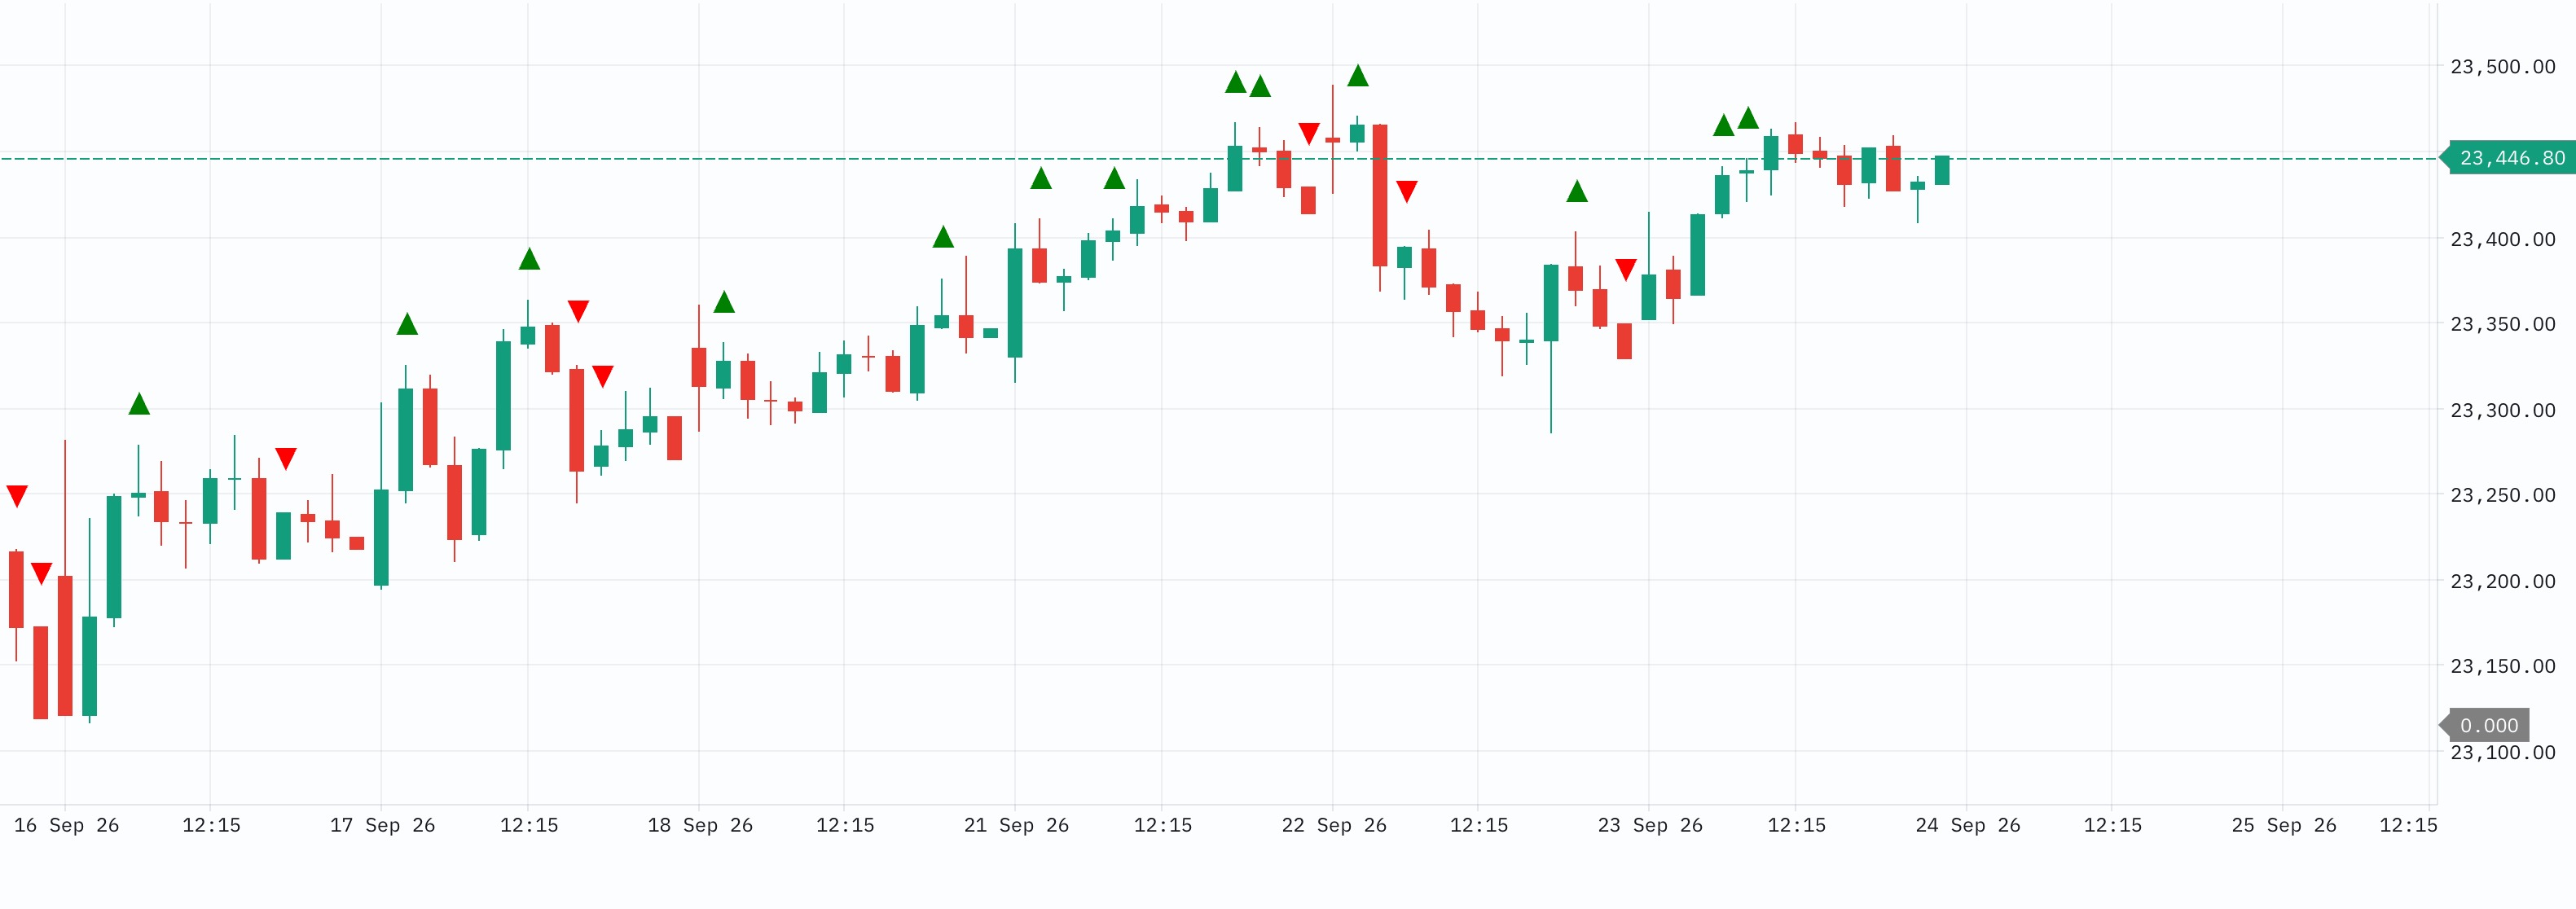
This script's source code is protected by the author.
Fair Value Gap (FVG) Indicator identifies three-candle price imbalances where aggressive movement leaves an inefficiently traded price zone between the first and third candles.
Core logic:
- Bullish FVG: Third candle's low is above the first candle's high.
- Bearish FVG: Third candle's high is below the first candle's low.
- Mark the resulting price zone as the FVG.
- Track whether the gap remains unfilled, partially filled, or fully mitigated.
- Give greater significance to FVGs aligned with market structure, liquidity sweeps, Volume Profile levels, Delta/CVD and Footprint imbalances.
For the Gocharting project: the FVG indicator should not merely draw boxes. It should eventually classify FVGs by direction, size, location, age, mitigation status, volume/Delta context and market regime, allowing them to become inputs into the broader setup/confluence engine.
The information and publications are not meant to be, and do not constitute, financial, investment, trading, or other types of advice or recommendations supplied or endorsed by GoCharting. Read more in the Terms of Use.
Comments (2)
Loading comments…