Buying / Selling aggression

This script's source code is protected by the author.
Buying / Selling Aggression
Marks candles where one side of the order flow clearly dominates, using GoCharting's trade-level buy and sell volume rather than total volume alone.
What it does
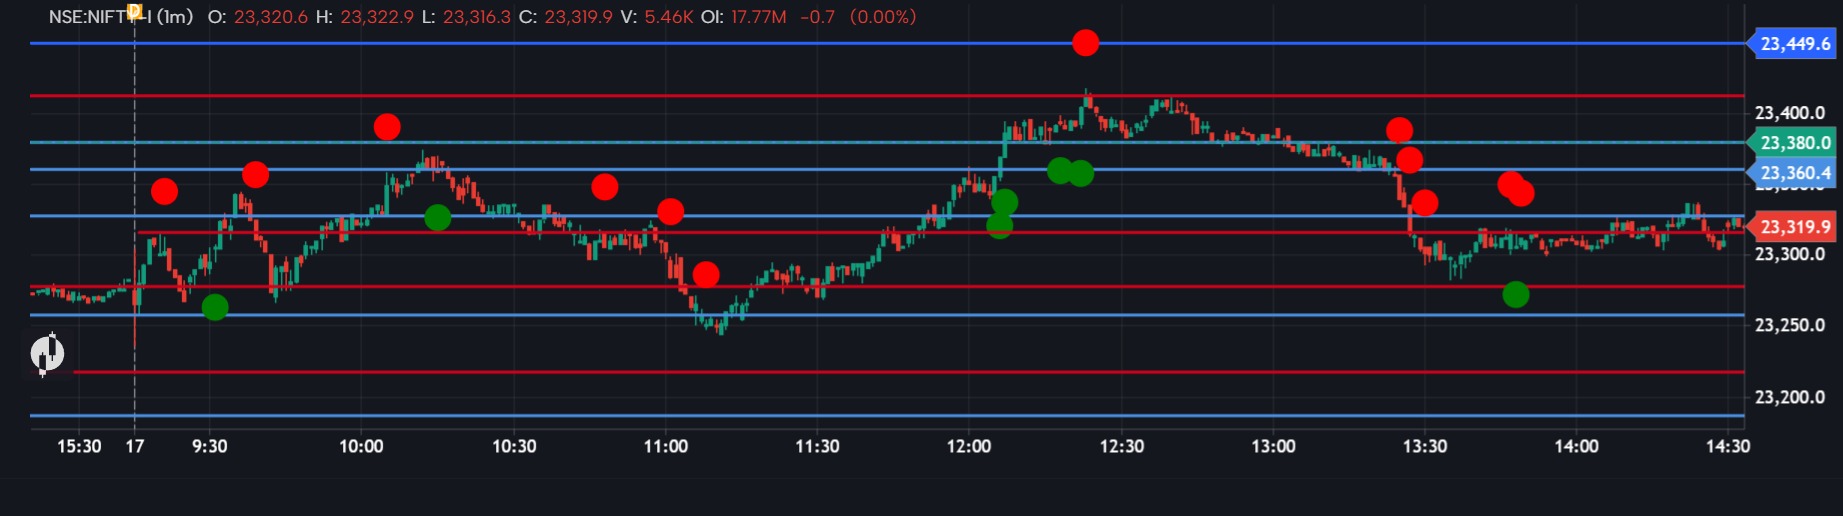
A green circle appears below a candle when aggressive buyers dominate; a red circle above when aggressive sellers do. A candle must pass two tests to qualify:
The dominant side's volume meets a minimum threshold
That side exceeds the other by a set ratio
The volume floor prevents quiet candles from qualifying on lopsided ratios built from very little trade.
Settings
Min Aggressive Volume (default 10,000) — the volume floor. Lower this on 1m charts, raise it on higher timeframes.
Imbalance Ratio (default 2) — how one-sided the candle must be. The more effective of the two filters; raise toward 2.0 to flag only extreme imbalance.
Circle Size (default 4) — 1 tiny through 5 huge.
Both alert conditions are exposed to the alert widget for webhook or notification use.
Calibration
Aim for roughly 5–15 markers per session. Too many means the ratio is too low; too few means the volume floor is too high.
How to use it
This is a scanner, not a signal. A marker in the middle of a range means little on its own. It carries information when it appears at a level you had already marked — value area edges, VWAP, session highs and lows. Aggression at a level being broken suggests the break is real; the absence of it on a break suggests the move lacks participation or there was an agressiona and it went in the opposite direction then its indicates that there was absorption.
Requires: a symbol and chart type with order flow data available.
Disclaimer
Built and calibrated for NIFTY futures. The default thresholds reflect NIFTY's volume profile and will not transfer to other instruments — on lower-volume symbols nothing will plot, and on higher-volume ones nearly every candle will. Recalibrate both settings before using it elsewhere.
Extra tip : use it on the previous day's VAH,VAL and POC of volume profile.
For education and analysis only. Not investment advice.
The information and publications are not meant to be, and do not constitute, financial, investment, trading, or other types of advice or recommendations supplied or endorsed by GoCharting. Read more in the Terms of Use.
Comments (2)
Loading comments…