 XAUUSD
test sma

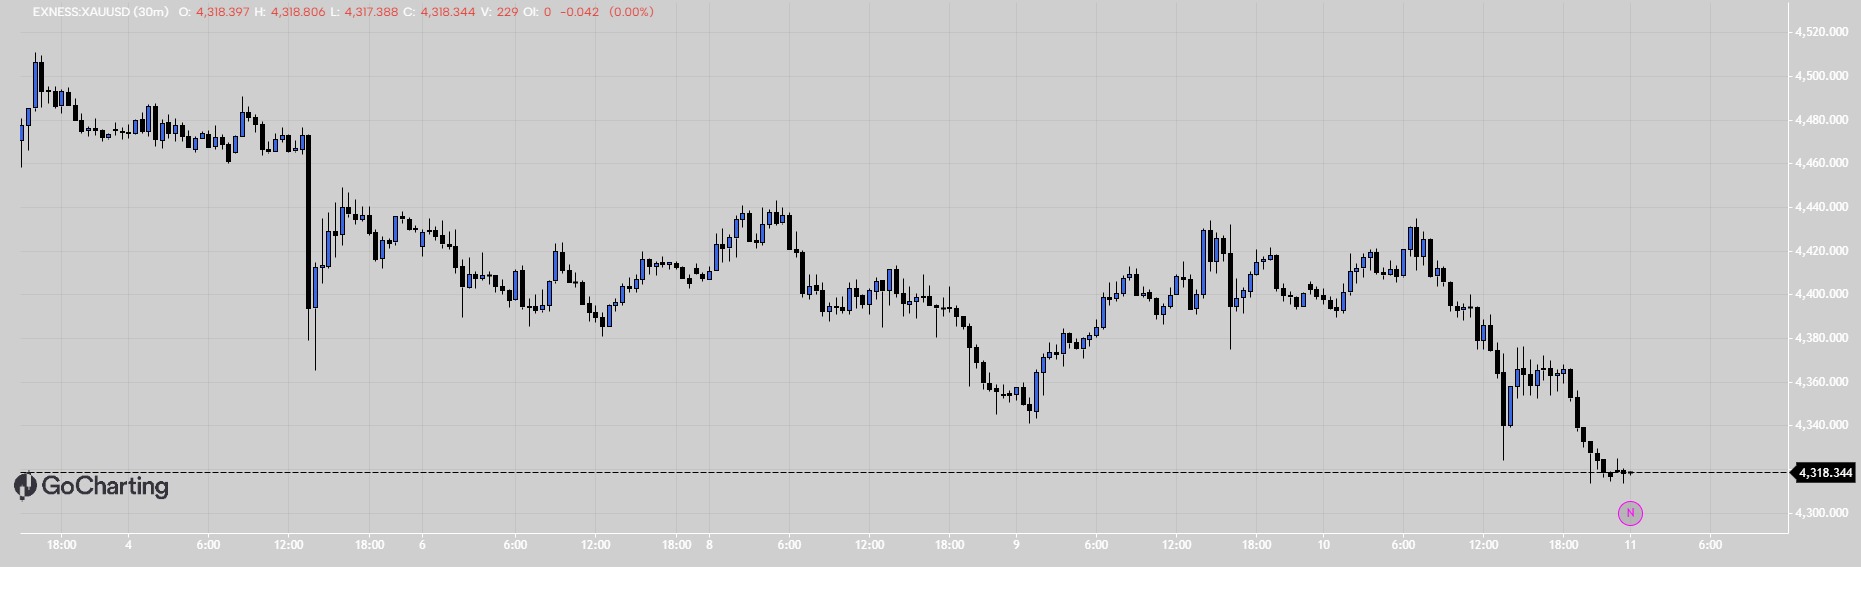
The Least Squares Moving Average (LSMA) is a technical indicator that uses linear regression to plot a line of best fit over a set of price data, helping traders identify trends with minimal lag. [1, 2]
How LSMA Works
Linear Regression: Instead of averaging past prices like a Simple Moving Average (SMA), LSMA calculates a regression line that minimizes the squared errors between the data points and the line over a rolling window. [1, 2]
Endpoint Plotting: For each time period, the indicator plots the end value of that calculated regression line, creating a continuous moving average curve. [1, 2]
Reduced Lag: Because it projects the trend rather than just taking a mean, it reacts much faster to price changes than traditional moving averages. [1, 2]
The information and publications are not meant to be, and do not constitute, financial, investment, trading, or other types of advice or recommendations supplied or endorsed by GoCharting. Read more in the Terms of Use.
Comments (0)
Loading comments…