 NESTLEIND
Nestle technical Analysis

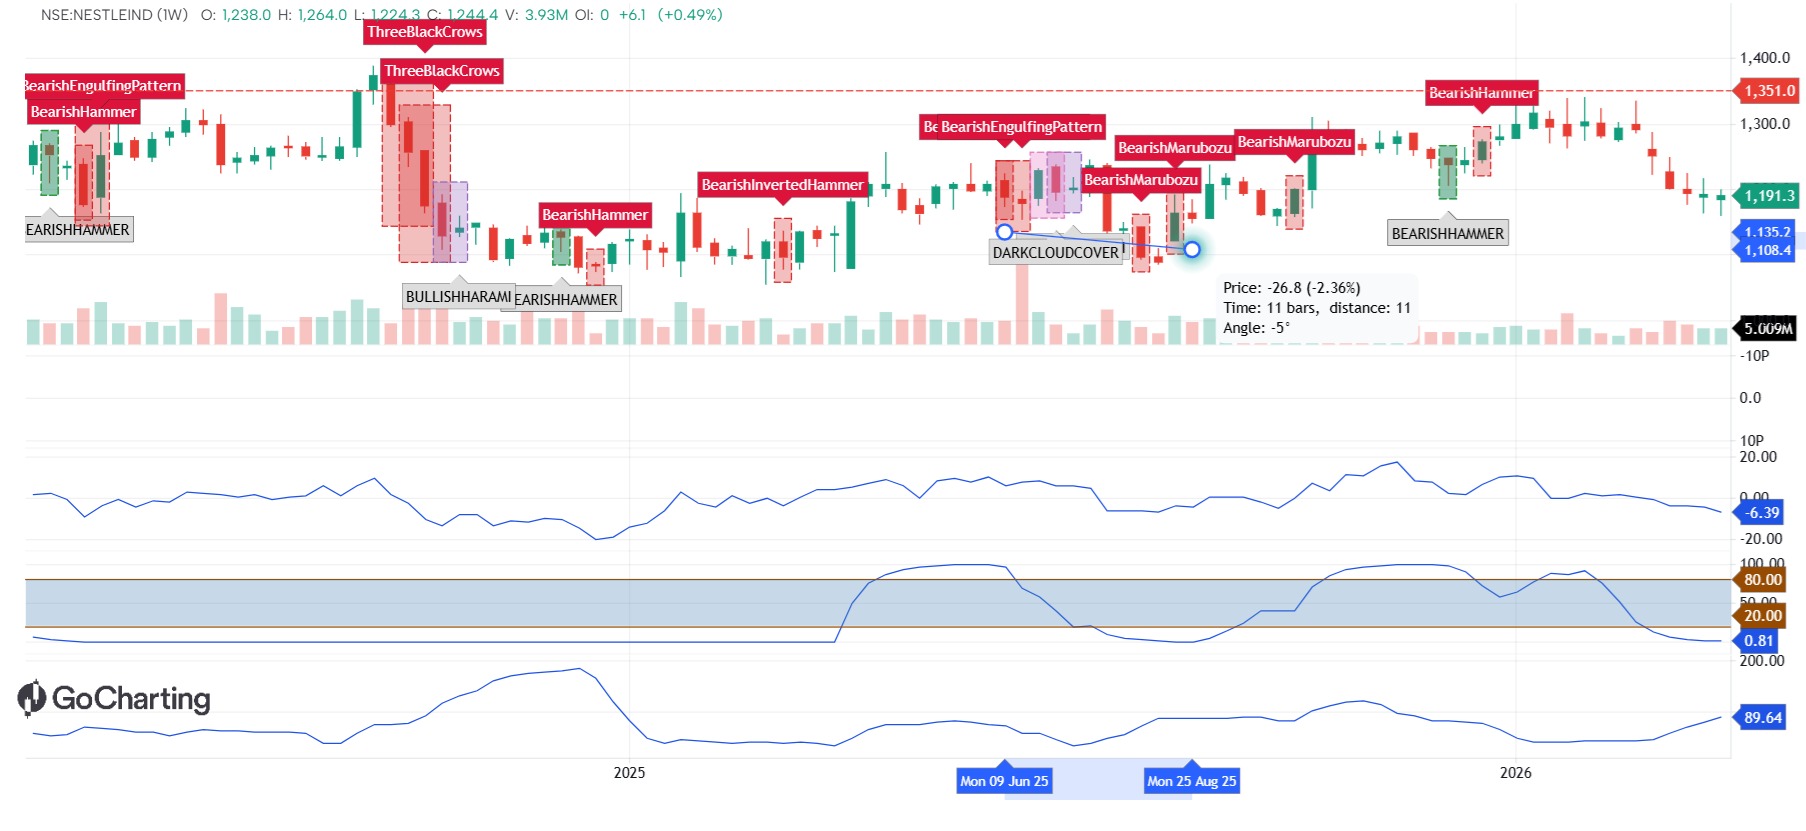
The analysis of Nestlé India shows the presence of several bearish reversal patterns, including Bearish Engulfing, Three Black Crows, Bearish Hammer, Bearish Inverted Hammer, and Bearish Marubozu. These patterns generally appeared near resistance or after upward price movements, indicating potential selling pressure and trend-reversal signals. The chart also shows periods of consolidation followed by strong directional movements, with volume providing additional confirmation for some signals. Overall, the identified candlestick patterns provide useful entry and exit signals when combined with support, resistance, and volume analysis.
The information and publications are not meant to be, and do not constitute, financial, investment, trading, or other types of advice or recommendations supplied or endorsed by GoCharting. Read more in the Terms of Use.
Comments (0)
Loading comments…