← All Analyses ETHUSDT
ETHUSDT脚本

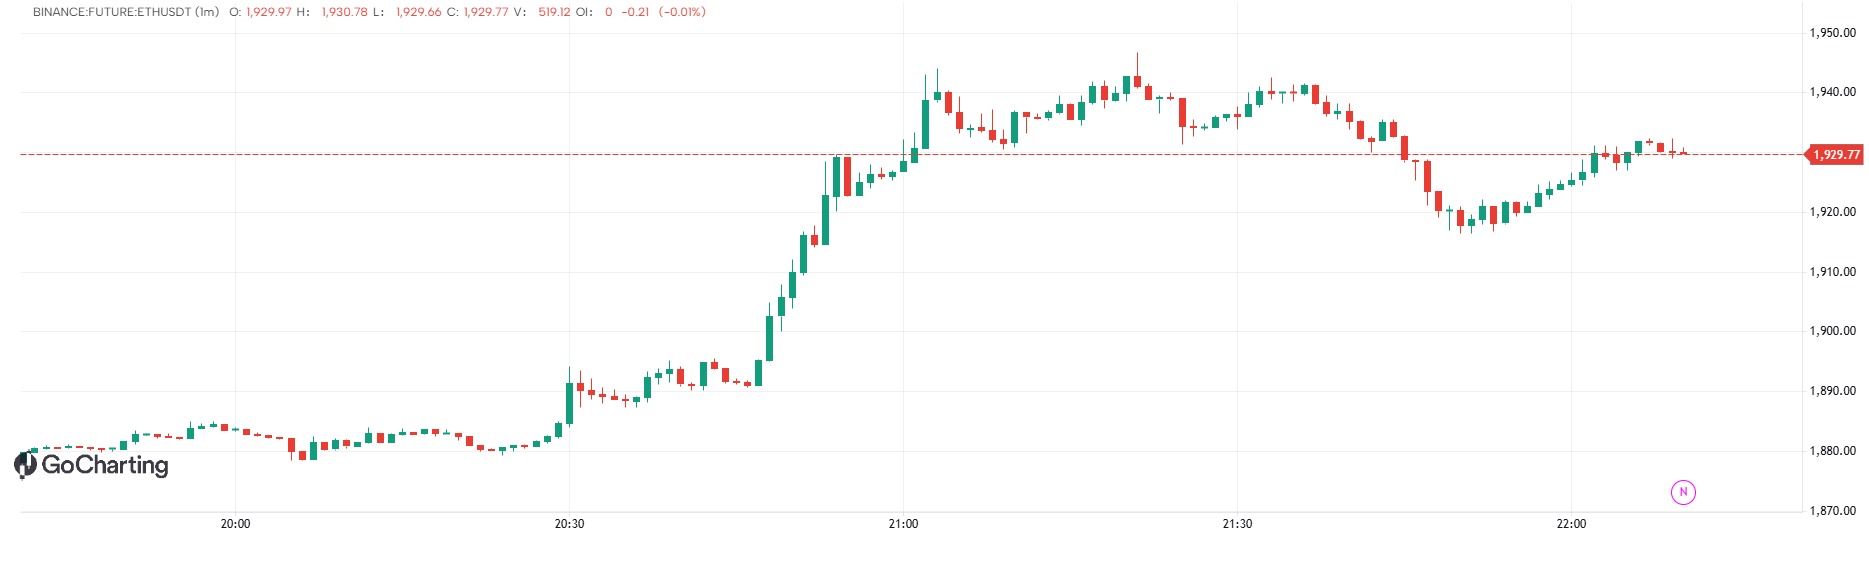
//@version=5
indicator("好用趋势信号脚本 v2", overlay=true, max_labels_count=500)
// ==================== 均线 ====================
ema20 = ta.ema(close, 20)
ema50 = ta.ema(close, 50)
ema200 = ta.ema(close, 200)
plot(ema20, color=color.blue, linewidth=2, title="EMA20")
plot(ema50, color=color.purple, linewidth=2, title="EMA50")
plot(ema200, color=color.orange, linewidth=2, title="EMA200")
// ==================== SuperTrend ====================
factor = input.float(3.0, "SuperTrend 因子", step=0.1)
period = input.int(10, "SuperTrend 周期")
[supertrend, direction] = ta.supertrend(factor, period)
plot(supertrend, color = direction == -1 ? color.green : color.red, linewidth=3, title="SuperTrend")
// ==================== MACD ====================
[macdLine, signalLine, _] = ta.macd(close, 12, 26, 9)
macdCrossUp = ta.crossover(macdLine, signalLine)
macdCrossDown = ta.crossunder(macdLine, signalLine)
// ==================== 买卖信号 ====================
buySignal = macdCrossUp and close > ema20 and direction == -1
sellSignal = macdCrossDown and close < ema20 and direction == 1
plotshape(buySignal, title="买入信号", location=location.belowbar, color=color.green, style=shape.triangleup, size=size.large)
plotshape(sellSignal, title="卖出信号", location=location.abovebar, color=color.red, style=shape.triangledown, size=size.large)
// 背景颜色提示
bgcolor(buySignal ? color.new(color.green, 90) : na)
bgcolor(sellSignal ? color.new(color.red, 90) : na)
Disclaimer
The information and publications are not meant to be, and do not constitute, financial, investment, trading, or other types of advice or recommendations supplied or endorsed by GoCharting. Read more in the Terms of Use.
Comments (0)
Loading comments…