 NIFTY
**NIFTY: THE STRUCTURE BEHIND THE NEXT BIG MOVE**

**NIFTY: THE STRUCTURE BEHIND THE NEXT BIG MOVE**
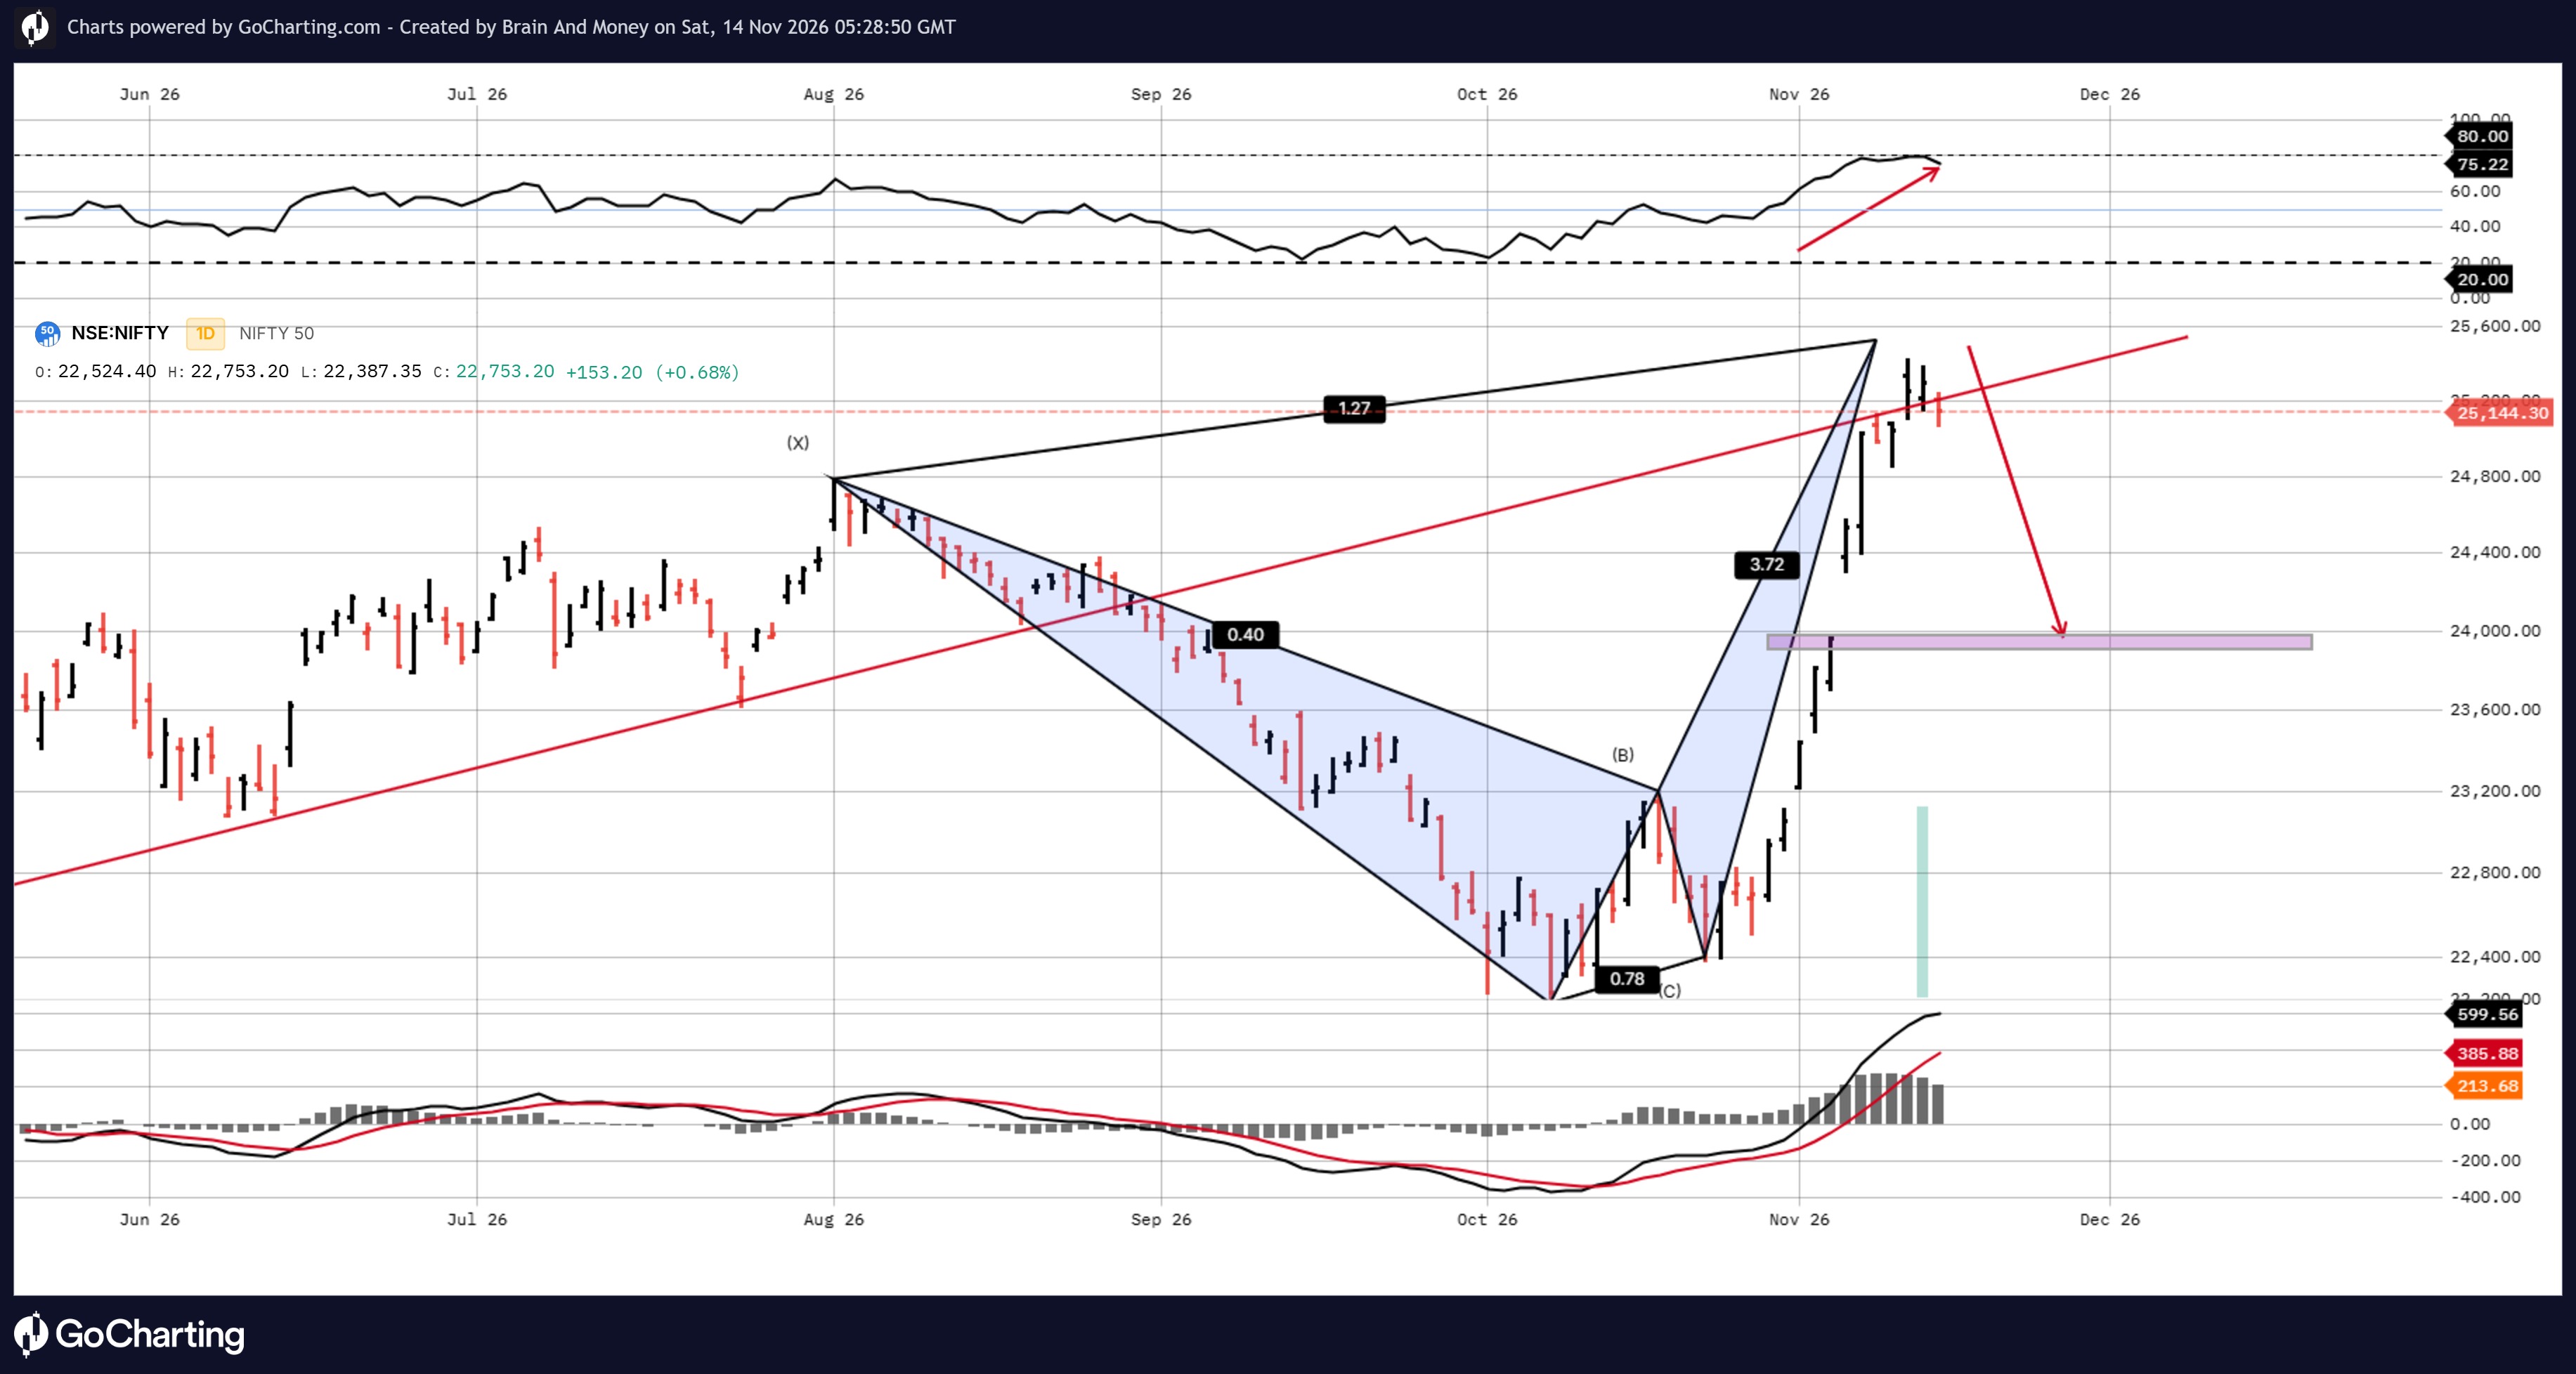
Markets don't move randomly. They move through phases of contraction, expansion, and retracement. The key is learning to read the structure before reacting to the price.
A closer look at Nifty's daily chart reveals three important technical observations:
**1. Harmonic Patterns & Fibonacci Geometry**
Fibonacci ratios (0.40, 0.78, 1.27 and 3.72) help identify potential reversal zones and structural price relationships. These are areas to watch, not guaranteed turning points.
**2. Consolidation to Breakout**
The corrective wedge reflects a contraction phase, followed by a sharp upside expansion. This highlights how patience during consolidation can help traders identify meaningful price-action opportunities.
**3. Retracement & Risk Management**
After a strong rally, a corrective move towards the 24,000 region remains a possibility. The projected downside path deserves attention, but confirmation from price action is essential.
**The Bigger Lesson:**
Successful trading is not about predicting every market move. It is about:
- Identifying market structure.
- Waiting for confirmation.
- Defining entry and invalidation levels.
- Managing risk before chasing returns.
At **Brain and Money**, we believe in research over speculation, discipline over emotions, and capital protection over aggressive predictions.
**Disclaimer:** For educational and informational purposes only. This analysis reflects an independent interpretation of publicly available information and is not investment advice or a recommendation to buy, sell, or hold any security. Please conduct your own research before making investment decisions.
The information and publications are not meant to be, and do not constitute, financial, investment, trading, or other types of advice or recommendations supplied or endorsed by GoCharting. Read more in the Terms of Use.
Related Analyses
Comments (0)
Loading comments…