Delta Rotations

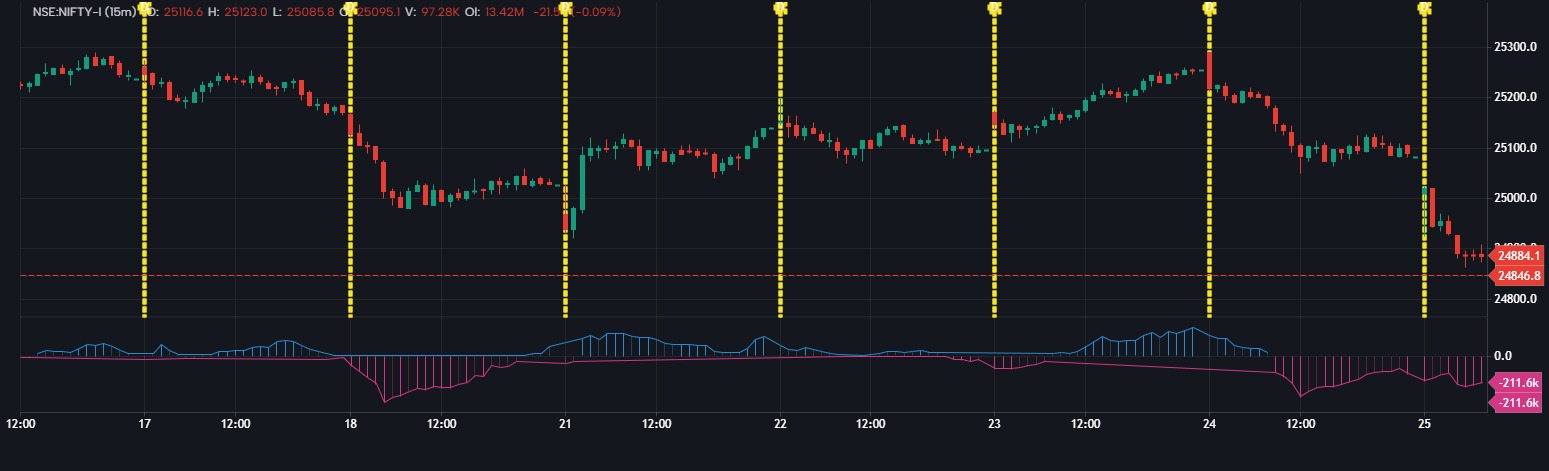
📊 Indicator Name: Delta Rotations
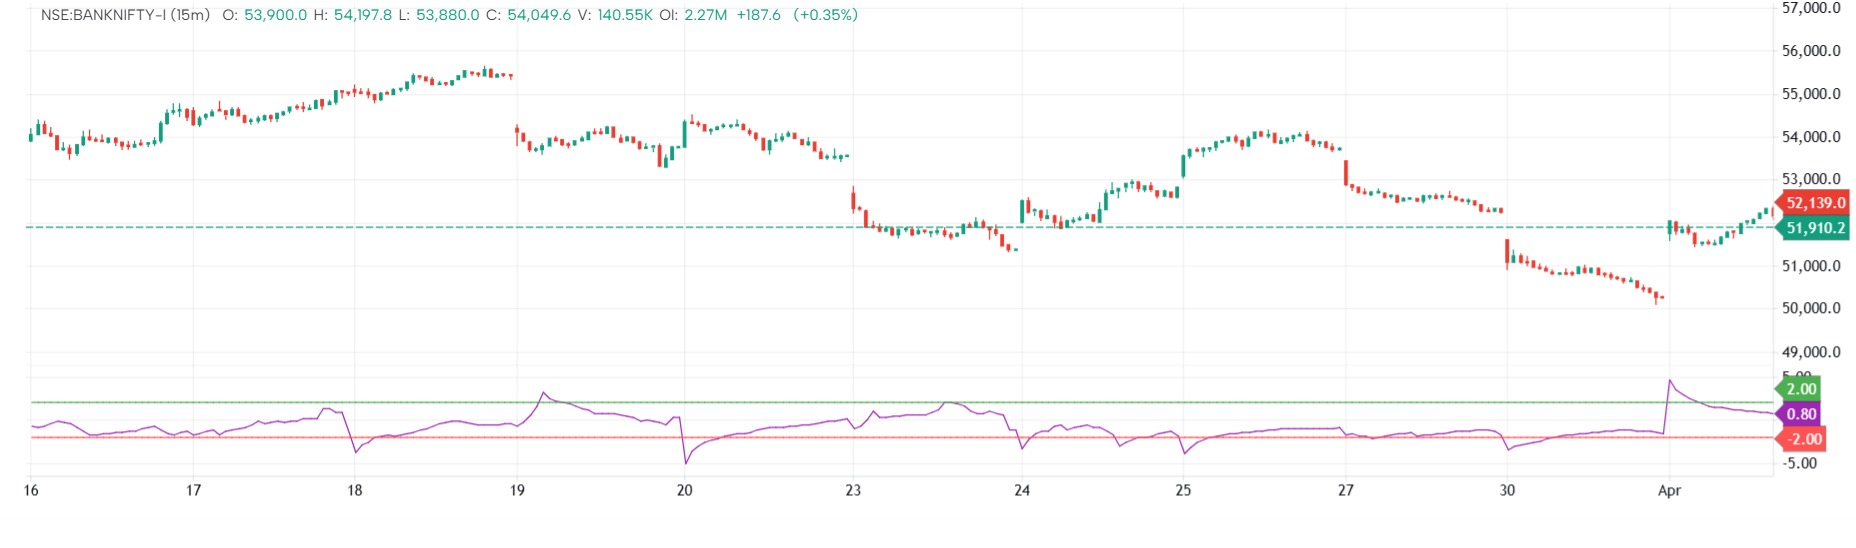
This advanced orderflow-based indicator visualizes Cumulative Volume Delta (CVD) rotations around a moving average to detect strong buying/selling shifts based on delta deviation.
🔍 Core Components:
vd = Buy Volume − Sell Volume
→ Per-bar volume delta.
cvd = Cumulative delta from vd
→ Shows net market pressure over time.
ma = Moving average of CVD
→ Used to find rotational deviation (delta = cvd - ma).
Rotational Extremes:
Positive rotation (h) is tracked when delta rises above prior highs, unless reset by bearish deviation.
Negative rotation (l) behaves similarly but on the downside.
Rotation values reset if delta crosses a 1-std-dev threshold in opposite direction.
Colors:
Bright blue (default #268bd2) when strong positive rotation with positive delta.
Magenta/red (default #d33682) when strong negative rotation with negative delta.
Faded colors when inside the standard deviation band.
Histogram:
Plots the delta as a histogram, color-coded by the rotation side.
✅ Use Case:
This tool helps identify:
Strong buying/selling swings (rotations) relative to mean CVD.
Momentum shifts using volume delta deviation.
Trend continuation or reversals, especially when rotation levels reset or break.
The information and publications are not meant to be, and do not constitute, financial, investment, trading, or other types of advice or recommendations supplied or endorsed by GoCharting. Read more in the Terms of Use.
Related Scripts
Comments (0)
Loading comments…