Volume Imbalance

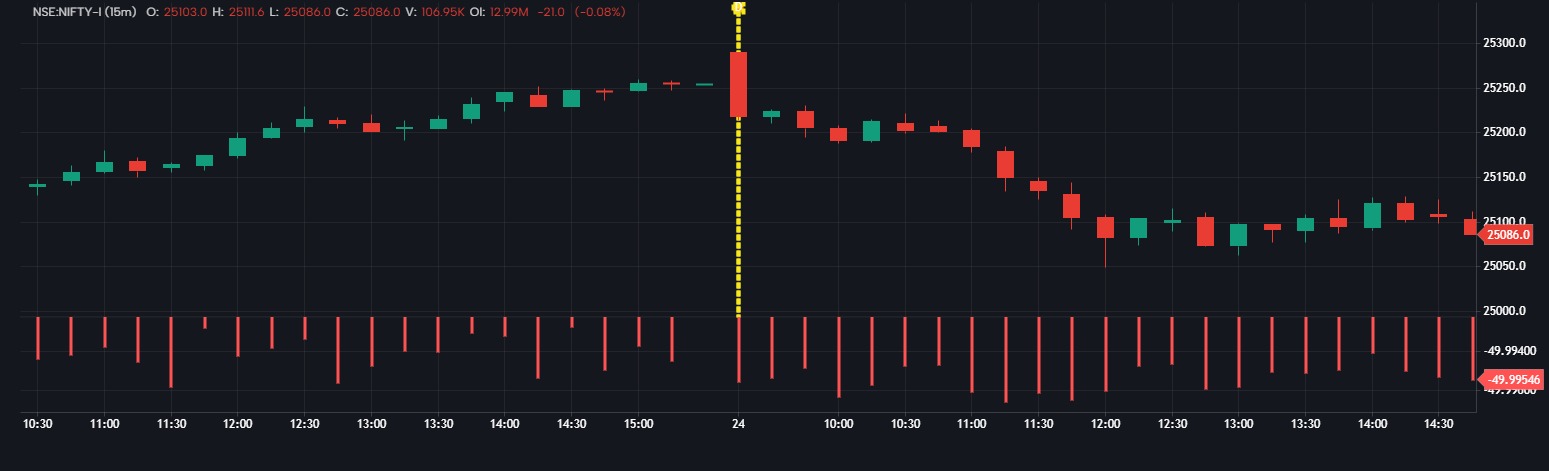
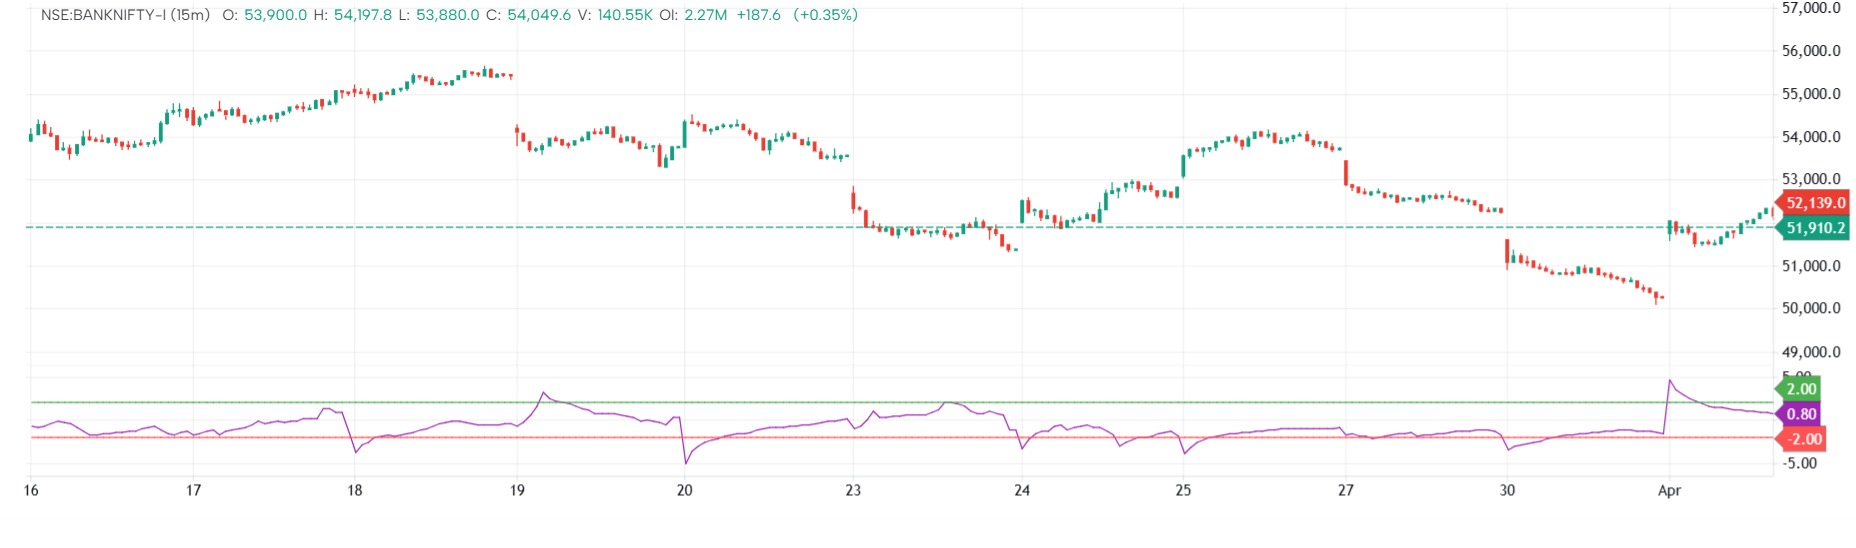
To visualize the relative dominance of buying vs. selling volume using a histogram centered around 0 (neutral).
⚙️ Key Components:
volumea: Total volume = Buy volume + Sell volume.
imb: Imbalance (%) = (Buy Volume / Total Volume) × 100 − 50
→ This centers the imbalance around 0, where:
Positive values → Buy dominance.
Negative values → Sell dominance.
color:
Blue (#2196F3FF) for positive (buy) imbalance.
Red for negative (sell) imbalance.
📊 What It Does:
Plots the percentage volume imbalance as a histogram.
Highlights whether buyers or sellers are aggressive in each bar.
📈 Use Case:
Detect buy/sell strength shifts.
Identify hidden accumulation/distribution.
Combine with price action to spot volume-confirmed breakouts or reversals.
The information and publications are not meant to be, and do not constitute, financial, investment, trading, or other types of advice or recommendations supplied or endorsed by GoCharting. Read more in the Terms of Use.
Related Scripts
Comments (2)
Loading comments…