Vwap with deviation

This indicator plots a VWAP (Volume-Weighted Average Price) with dynamic deviation bands around it.
VWAP Calculation
VWAP is computed per session, resetting at the start of each new session.
It uses cumulative volume and price–volume products to calculate the session-average price weighted by volume.
Deviation Bands
The script calculates variance and standard deviation of price relative to VWAP.
Upper and lower bands are drawn at:
VWAP±Deviation Multiplier×Std Dev
Usage
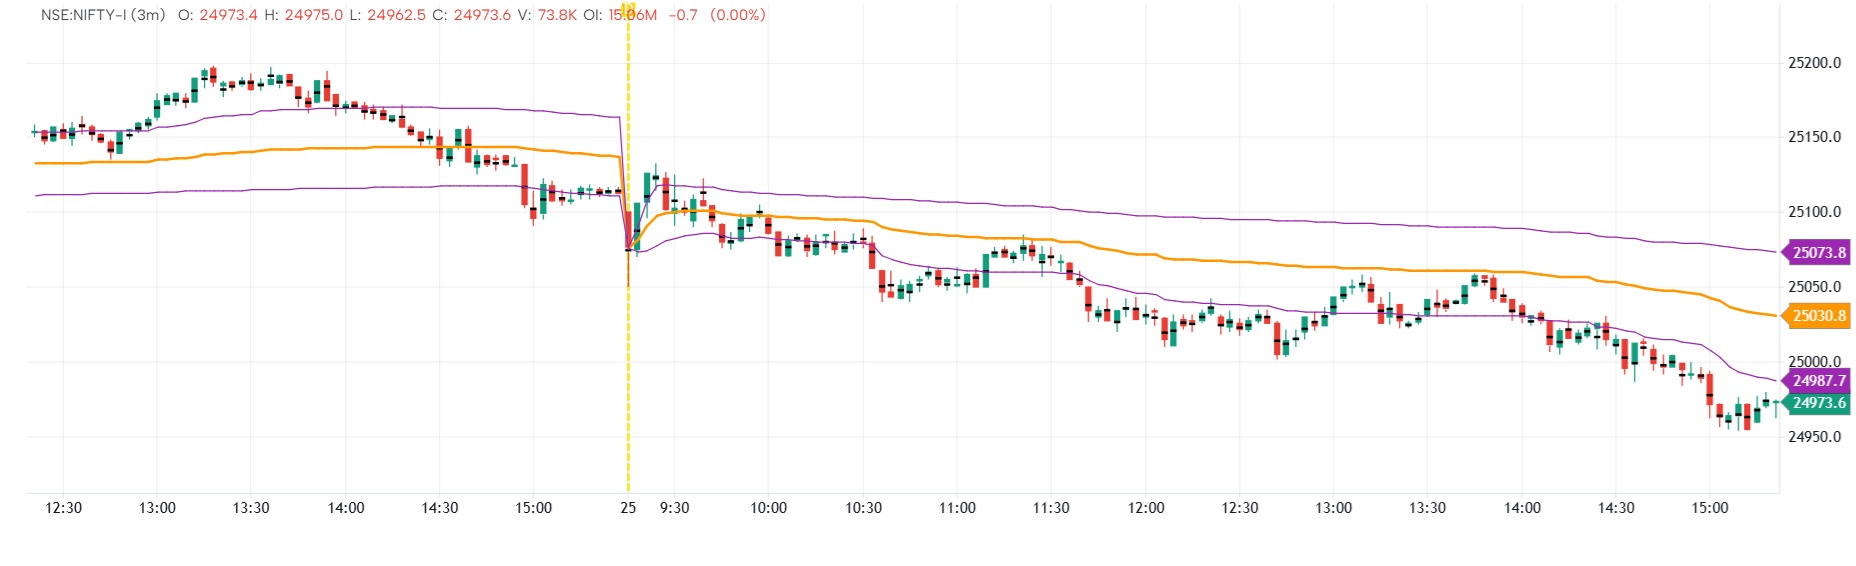
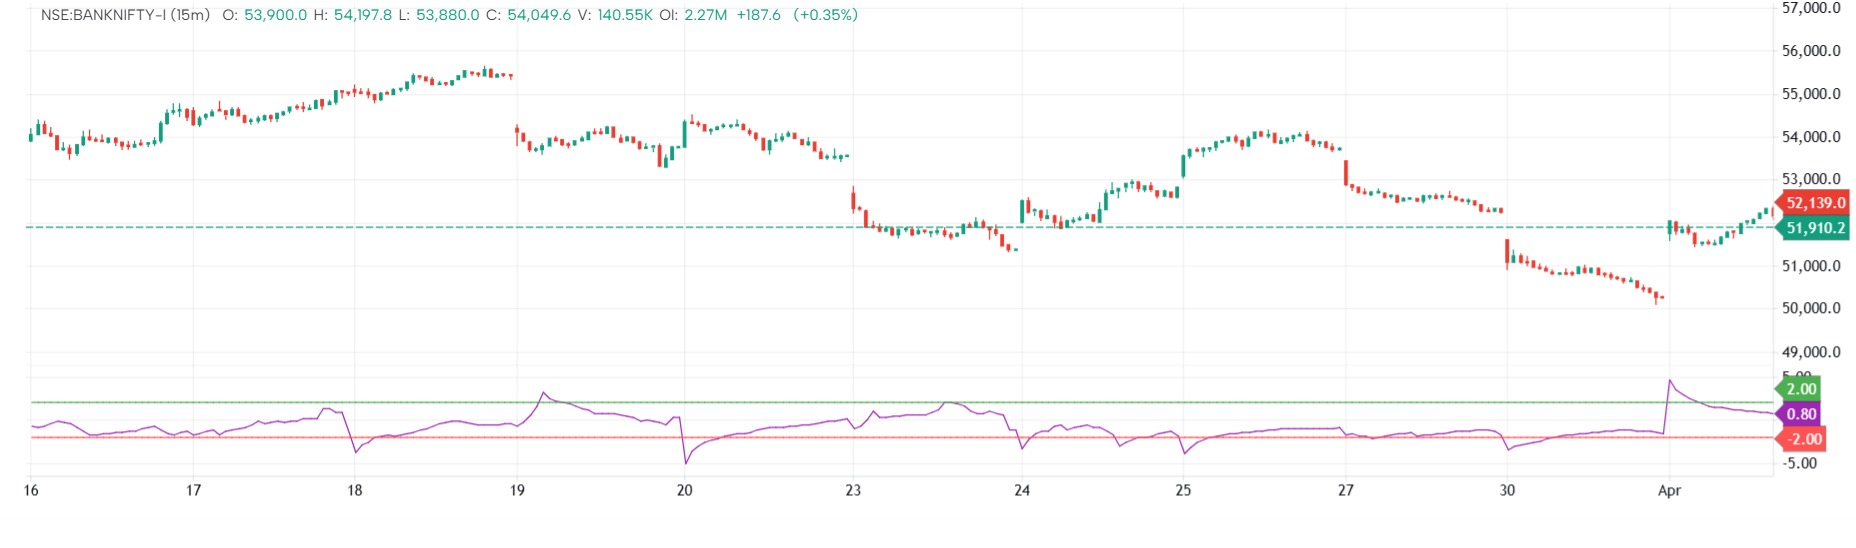
VWAP (orange line) serves as a dynamic average price benchmark used by institutions.
Deviation bands (purple lines) highlight overbought/oversold zones relative to VWAP.
Crossovers of price with VWAP or its bands can signal mean reversion, trend continuation, or volatility extremes.
Flexibility
The Deviation Multiplier input lets users adjust sensitivity (e.g., 1 = 1 standard deviation, 2 = 2 deviations, etc.).
The information and publications are not meant to be, and do not constitute, financial, investment, trading, or other types of advice or recommendations supplied or endorsed by GoCharting. Read more in the Terms of Use.
Related Scripts
Comments (0)
Loading comments…