← All Scripts
Sigma Volume

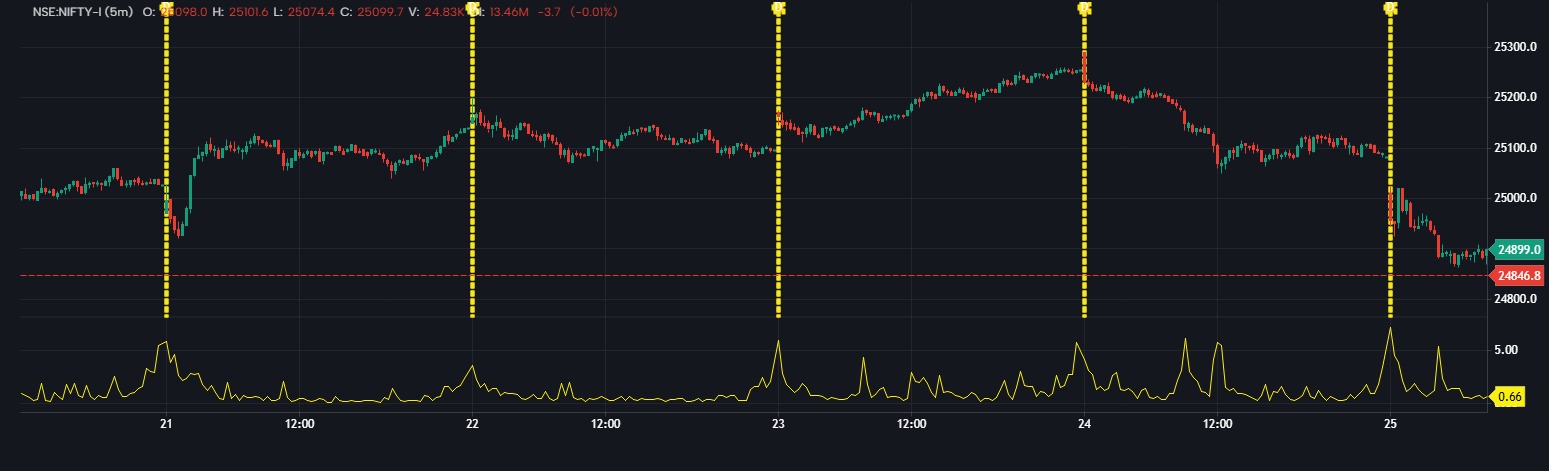
📊 Sigma Volume Indicator – Short Analysis
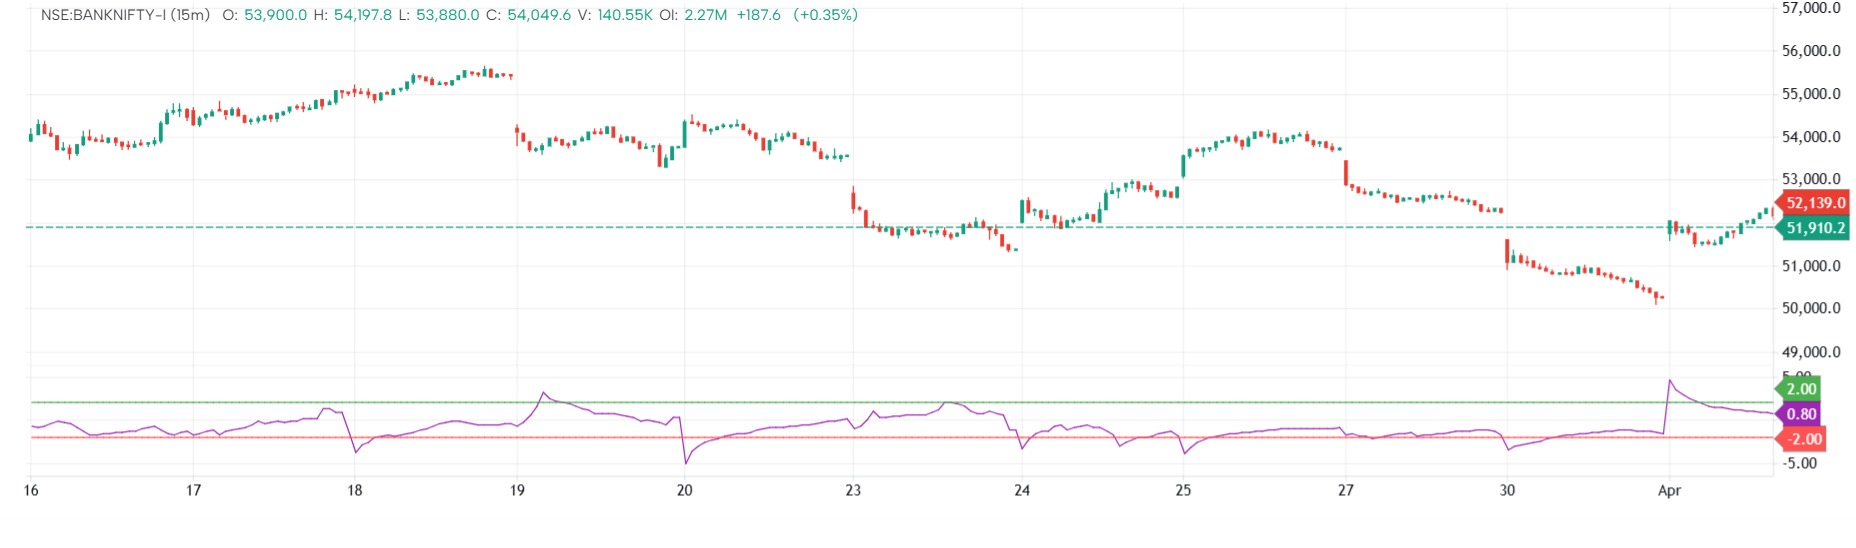
This indicator highlights unusual volume activity by comparing the current total volume with its recent history.
When the line spikes up, it signals a sudden surge in volume.
Consistently high levels can indicate strong market participation, often around breakouts or key events.
Low values suggest quiet or consolidating market conditions.
It’s a helpful tool to spot volume anomalies that may precede sharp price moves.
Disclaimer
The information and publications are not meant to be, and do not constitute, financial, investment, trading, or other types of advice or recommendations supplied or endorsed by GoCharting. Read more in the Terms of Use.
Related Scripts
Comments (0)
Loading comments…